


27
.
www.velodyne.com
Digital Drive User’s Manual
C
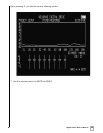
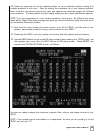
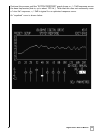
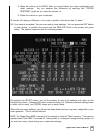
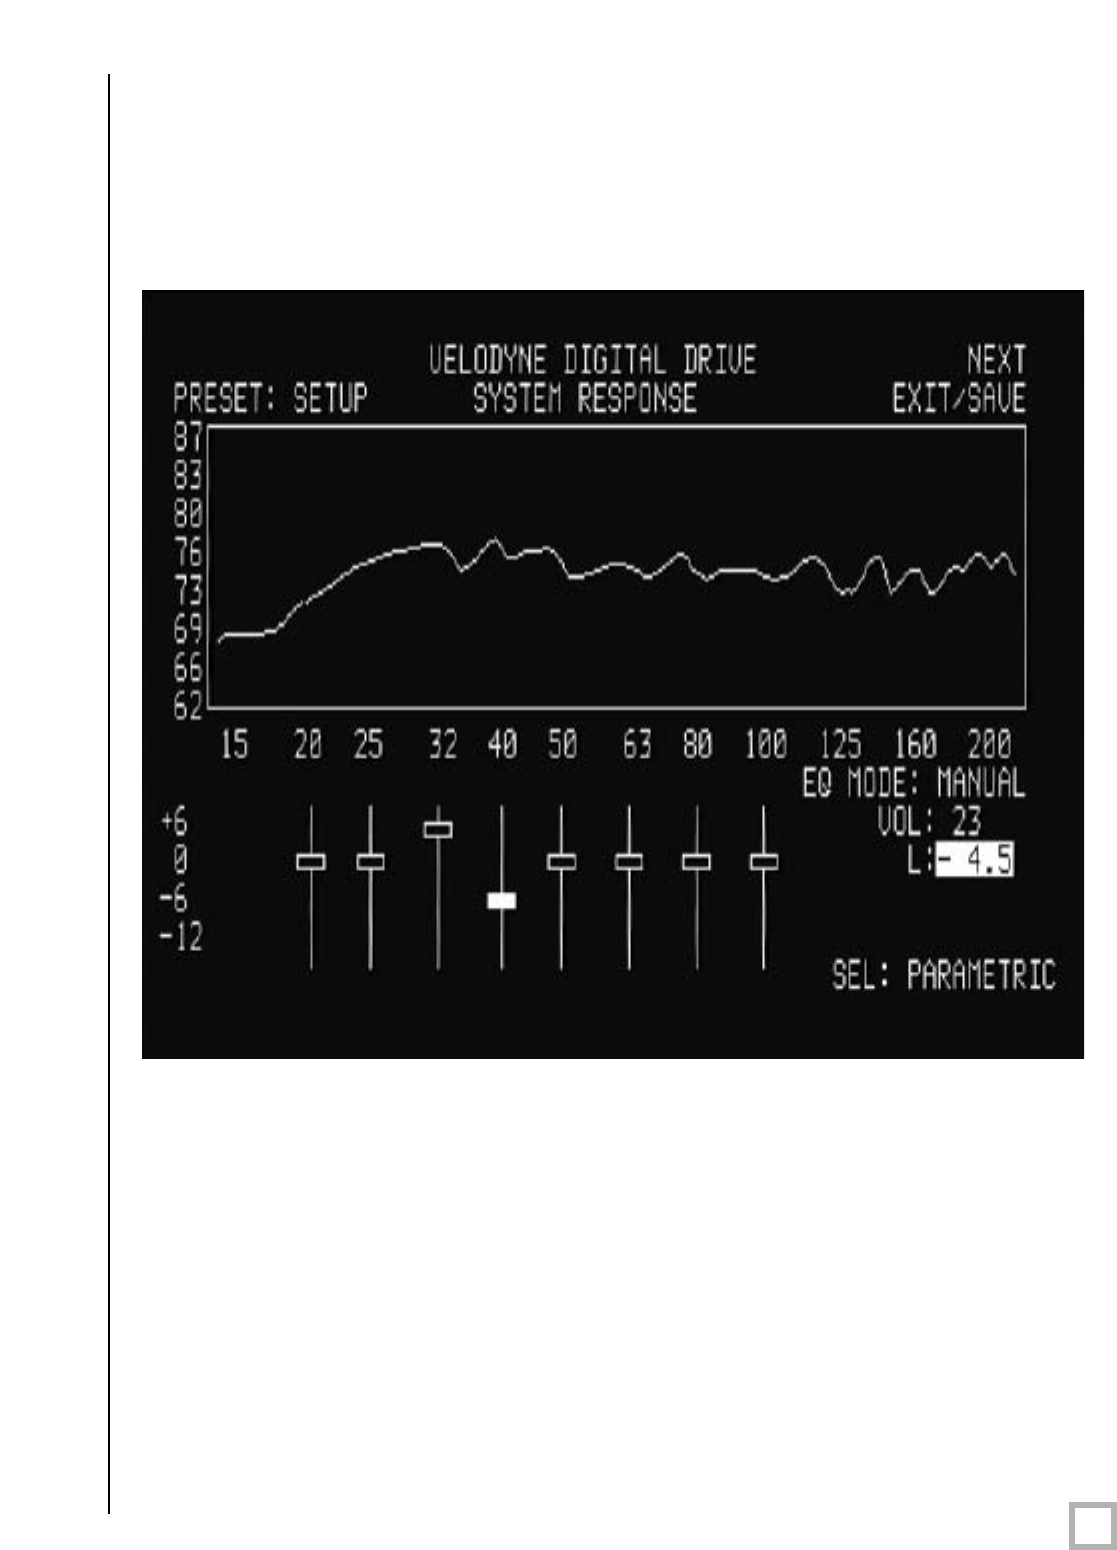
ontinue this process until the “SYSTEM RESPONSE” graph shows a +/
– 3
dB response across
the bass frequencies (that is, up to about 120 Hz.). Note that this does not necessarily mean
a
“ruler flat” response; +/
- 3
dB is typical for an optimized response curve.
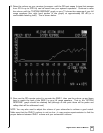
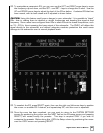
An “equalized” room is shown below: