Measuring Waveforms
CSA7000 Series, TDS7000 Series, & TDS6000 Series Instruments User Manual
3- 149
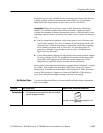
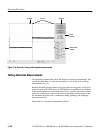
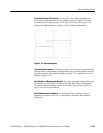
Annotate Waveforms On Screen. You can create text to mark characterization
levels that each measurement uses to compute results (see Figure 3--34). See
Customizing the Display on page 3--138, Label the Waveform on page 3--255,
and Annotate Measurements on page 3--155 for additional information.
Figure 3- 34: Annotated display
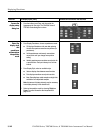
Customize Measurements. To allow you control over how your waveform data is
characterized by measurements, the instrument lets you set the methods used for
each measurement. See High/Low Method on page 3--151 and Reference Levels
Method on page 3-- 152.
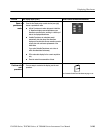
See Statistics on Measurement Results. To see how automatic measurements vary
statistically, you can display a readout of the Min, Max, Mean, and Standard
Deviation of the measurement results. See Display measurement statistics on
page 3--155 for more information.
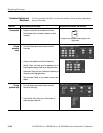
Select Measurement Parameters. You can select from an extensive range of
parameters to measure; for a list, see Appendix B: Automatic Measurements
Supported.


