


23
How to Interpret the Graphs (Continued)
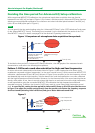
About the display of the reverb characteristics graphs before
and after calibration
By comparing the reverberation characteristics graphs before and after calibration, you can check how the
reverb characteristics have been calibrated. Select “Before” to display the graph of the reverberation
characteristics before EQ calibration, “After” to display the graph of the reverb characteristics after EQ
calibration. If you want to check the actually measured reverb characteristics after EQ calibration, see
Displaying the reverb characteristics after EQ calibration (actually measured values)
(page 24).
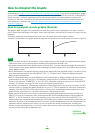
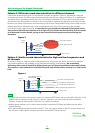
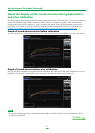
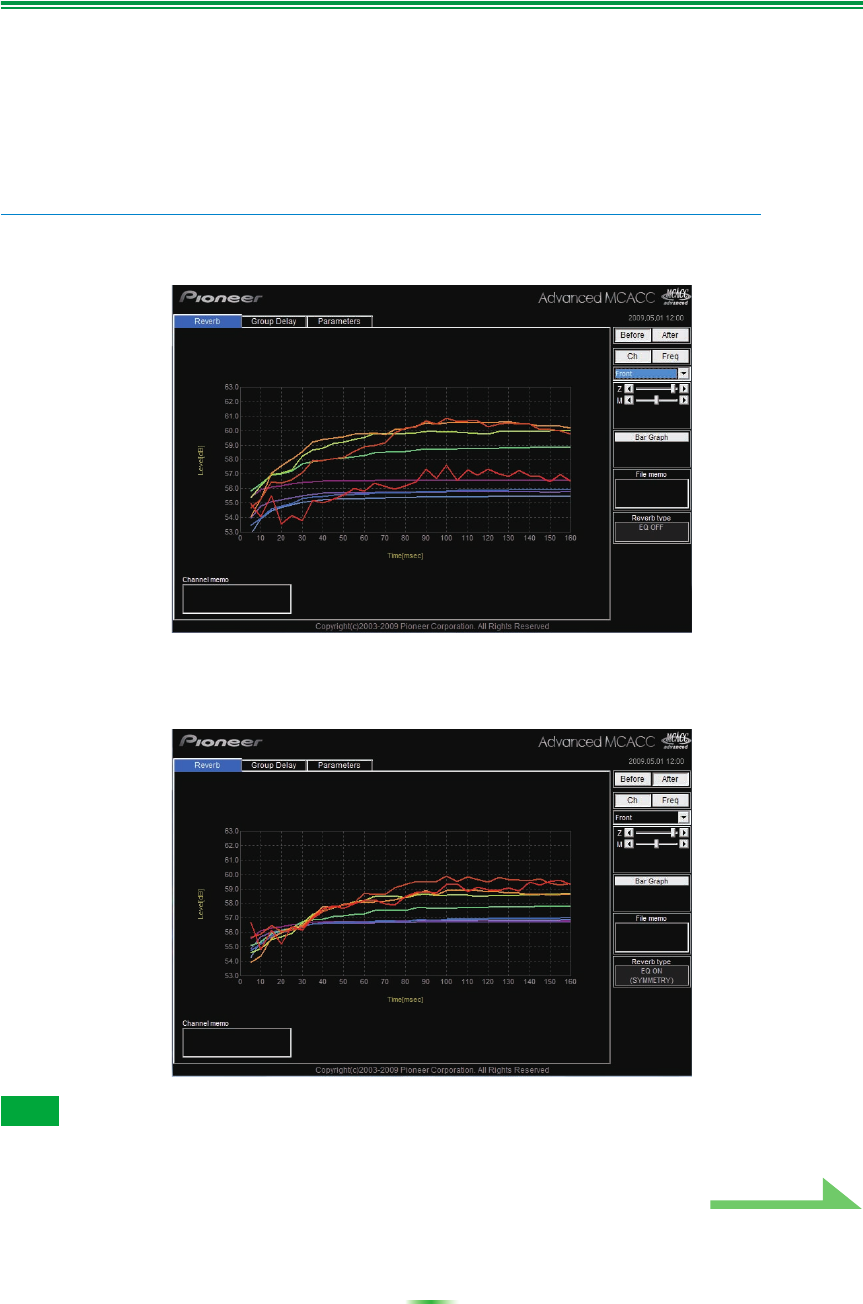
Graph of reverb characteristics before calibration
You can see that the reverb characteristics of the various frequencies of the different channels are uneven.
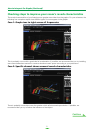
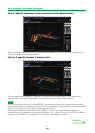
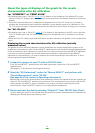
Graph of reverb characteristics after calibration
You can see that compared to the graph before calibration the lines for the individual frequencies move in
parallel by the amount of equalization and converge at the specified point on the time axis.
• The graphs displaying reverb measurements both before and after calibration are displayed in 2-D for
comparison purposes.
Note
Continue