


Chapter 2 Measurement Studio .NET Class Libraries
Measurement Studio User Manual 2-38 ni.com
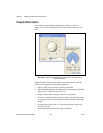
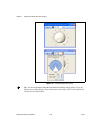
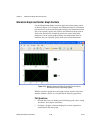
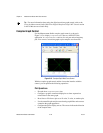
Waveform Graph and Scatter Graph Controls
Use the Measurement Studio waveform graph and scatter graph controls,
as shown in Figure 2-13, to display two-dimensional data on a Web-based
user interface. Use the waveform graph to display two-dimensional linear
data. You explicitly specify each value in one dimension and provide an
initial value and interval to implicitly specify the values in the other
dimension. Use the scatter graph to display two-dimensional linear or
nonlinear data: you explicitly specify each value in both dimensions.
Figure 2-13. Waveform Graph and Scatter Graph Web Forms Controls;
Both Graphs Have Corresponding Legends
With the waveform graph and scatter graph controls and the classes that
interface with the controls, you can perform the following operations:
Plot Operations
• Plot and chart arrays of double-precision floating point values, analog
waveforms, and complex waveforms.
• Configure a graph to contain multiple plots to show separate but
related data on the same graph.