


Chapter 2 Measurement Studio .NET Class Libraries
Measurement Studio User Manual 2-22 ni.com
Cursor Operations
• Use cursors to identify key points in plots and the plot area.
• Configure cursor snap modes to be fixed, floating, nearest point, or
to plot.
• Use cursor labels to display X and Y data coordinates in a customized
format that the cursor crosshair points to, and customize the text font
and colors of the label.
• Create custom point and line styles for cursors.
• Interactively move the cursor by clicking and dragging the vertical or
horizontal crosshair or the center of the cursor.
• Programmatically move the cursor to previous or next position or to a
specified coordinate.
Annotation Operations
• Configure text labels, arrows, and drawing shapes to annotate a point
anywhere in the plot area of the graph.
• Configure range area, text labels, and arrows to annotate a range in the
plot area of the graph.
• Show tooltips configured to display data or other custom text.
Additional Operations
• Pan and zoom interactively, as well as programatically.
• Copy the graph as a BMP, GIF, JPEG, or PNG image to the clipboard
or a file.
• Perform hit testing of mouse cursor coordinates.
• Bind a plot to a data source on the waveform graph.
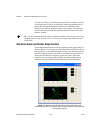
Tip For more information about using the waveform and scatter graph controls, refer to
the Using the Measurement Studio Windows Forms Scatter and Waveform Graph .NET
Controls section in the NI Measurement Studio Help.