


Chapter 2 Measurement Studio .NET Class Libraries
© National Instruments Corporation 2-25 Measurement Studio User Manual
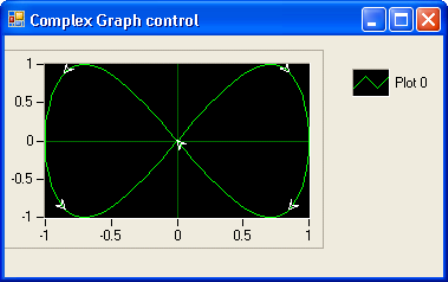
Complex Graph Control
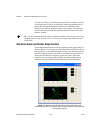
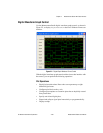
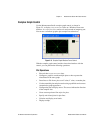
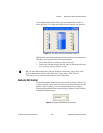
Use the Measurement Studio complex graph control, as shown in
Figure 2-3, to display
ComplexDouble data on a Windows Forms user
interface. A
ComplexDouble consists of a real part and an imaginary part.
You can use a waveform graph to plot complex waveform data.
Figure 2-3. Complex Graph Windows Forms Control
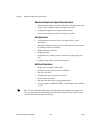
With the complex graph control and the classes that interface with the
control, you can perform the following operations:
Plot Operations
• Plot and chart ComplexDouble data.
• Configure a graph to contain multiple plots to show separate but
related data on the same graph.
• Draw lines or fills from a plot to an X value, Y value, or another plot.
• Use the extensible plot and plot area drawing capabilities and events to
customize the graph appearance.
• Configure the plot to display arrows. The arrows indicate the direction
of the complex data.
• Create custom point and line styles for plots.
• Specify anti-aliased plots for plot lines.
• Calculate and display error bands.
• Display tooltips.