


Chapter 2 Measurement Studio .NET Class Libraries
Measurement Studio User Manual 2-24 ni.com
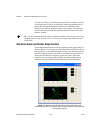
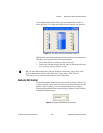
Waveform Sample and Signal State Operations
• Simultaneously display waveforms and signals or display signals only.
• Create custom waveform sample and signal state styles.
• Configure the appearance of sample and state labels.
• Create custom waveform sample and signal state labels.
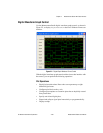
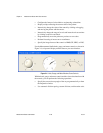
Axis Operations
• Configure the axis modes to fixed, exact autoscaling, or loose
autoscaling.
• Interactively change the range of an axis and invert the axis at run time
by clicking on the axis end labels.
• Display captions on the axis.
• Display grid lines.
• Position the axis to display on one or both sides of the graph’s plot
area.
• Configure major, minor, and custom divisions.
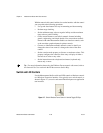
Additional Operations
• Display data in sample or time mode.
• Perform hit testing of mouse cursor coordinates.
• Pan with scroll bars.
• Configure the style and mode of scroll bars.
• Create custom scroll bars.
• Pan and zoom interactively and programmatically.
• Copy the graph as a BMP, GIF, JPEG, or PNG image to the clipboard
or a file.
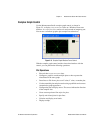
Tip For more information about using the digital waveform graph control, refer to the
Using the Measurement Studio Windows Forms Digital Waveform Graph .NET Control
section in the NI Measurement Studio Help.