


Chapter 5 Getting Started with Measurement Studio
Measurement Studio User Manual 5-18 ni.com
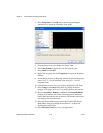
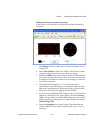
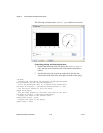
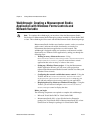
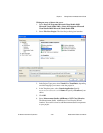
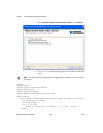
The following screenshot shows Default.aspx with the user controls.
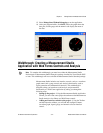
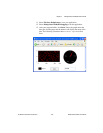
Generating, plotting, and analyzing the data
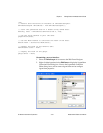
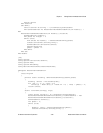
1. Double-click the button control to display the
Default.aspx.cs
code, with the cursor inside the click event handler of the button
control.
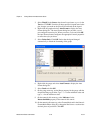
2. Add the following code to generate random data, plot the data,
calculate the mean of the data, and display the mean on the gauge.
[VB.NET]
' Declare and initialize an instance of WhiteNoiseSignal.
Dim whiteNoise As New WhiteNoiseSignal()
' Store the generated data in a double array named data.
Dim data As Double() = whiteNoise.Generate(1000.0, 256)
' Use the PlotY method to plot the data.
graph.PlotY(data)
' Use the Mean method to calculate the mean of the data.
Dim mean As Double = Statistics.Mean(data)
' Display the mean on the numeric edit.
numericedit.Value = mean
' Display the mean on the gauge.
gauge.Value = mean