


44
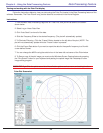
Viewing and working with the Polar Plot display
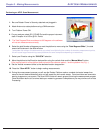
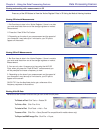
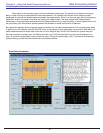
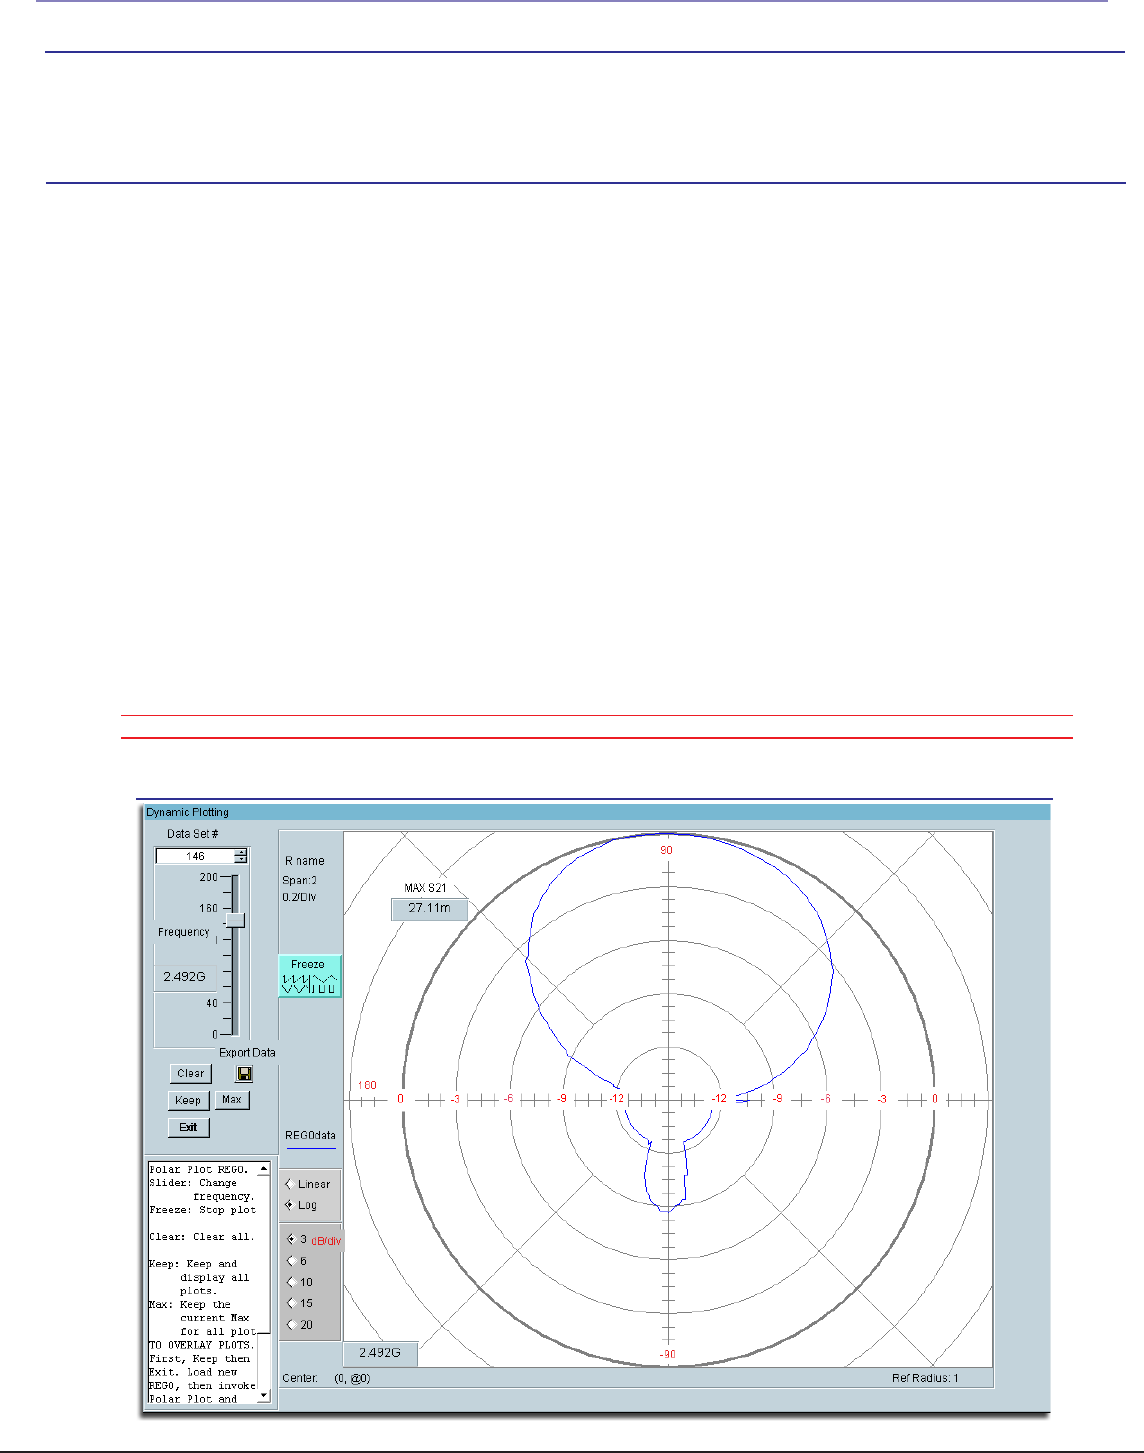
1. From the Main Data Processing Page click on “Polar Plot” and you will be taken to the screen
shown below
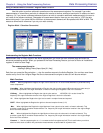
2. Select Log or Linear Data View.
3. Click “Auto Scale” to view all of the data
4. Slide the Frequency Slider to the desired frequency. (The plot will automatically update).
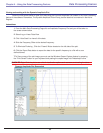
5. To Eliminate Flickering , Click the “Freeze” Button located on the left side of the plot. (NOTE: The
plot will not automatically update while the “Freeze” button is pressed”
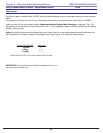
6. Click the Export Data button if you want to export the data for the specific frequency to a file with
a user defined format.
7. You can change the dB/Div using the selction box in the lower left nad corner of the Plot window.
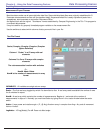
8. To Save a copy of the plot image you must use the Windows Screen Capture feature by pressing
the “Print Screen” button on your keyboard and pasting the copied image into Photoshop or other
image editing program.
Polar Plot Screenshot
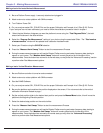
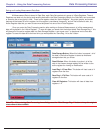
Follow the Instructions below to view your data using the Polar Plot located in the Data Processing feature of the
software. Remember, The Polar Plot will only plot the data that is contained in the Active Register.
QUICK TIP: Right-Click the plot to see a list of visualization options such as zoom, and scaling functions.
Instructions:
Data Processing FeatureChapter 4 - Using the Data Processing Feature