


32
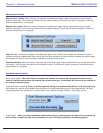
Visualization Options
The data visualuzation options enables you to view the Antenna Data in a wide variety of formats.
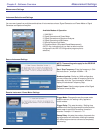
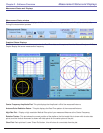
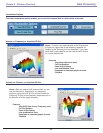
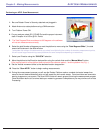
Azmuth vs. Frequency vs. Amplitide 3D Plot
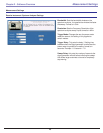
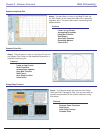
Azimuth vs. Elevation vs. Amplitude 3D Plot
About: This plot is the most versatile of the 3D plots and
will gve you a good idea of the frequency response Vs.
Rotation of the Antenna you have measured . If you have
made Az/El measurements you can use the Az/El 3D plot
for a more detailed view.
Features
View entire data set at once
Full Plot Rotation
Zoom In/Out feature
Line and Notation Tools
Exportable to common graphic formats
Printable
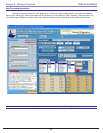
About: After you make a Az/El measurement you can
view the Azimuth vs. Elevation for any measured
frequency using the Az/El 3D Plot use the Azimuth Vs
Frequency 3D plot to view frequency response to aid in
the selection of of the single frequency.
Features
View Az/El Data for any Frequency point
Full Plot Rotation
Zoom In/Out feature
Line and Notation Tools
Exportable to common graphic formats
Printable
Chapter 2 - Software Overview Data Processing