


3-1
Chapter 3
Features Of Fluke 433/434
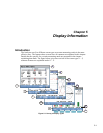
Introduction
The Analyzer offers an extensive and powerful set of measurements to check power
distribution systems. Some give a general impression of power system performance.
Others are used to investigate specific details. This chapter gives an overview on how to
perform measurements in a logical order.
The measuring modes are described in detail in Chapter 7 to 16. Each measuring mode is
explained in a separate chapter.
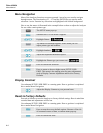
Fluke 434 has additional features such as Interharmonics, Transients, Energy
Usage, extra memory to store Screens and Data, FlukeView software, and an optical
isolated interface cable. In Fluke 433 these functions can be installed optionally. If
not installed, they are shown in the menus in grey color.
General Measurements
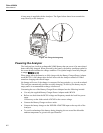
To check if voltage leads and current clamps are connected correctly, use Scope
Waveform and Scope Phasor. The clamps are marked with an arrow to facilitate proper
signal polarity. Chapter 6 Input Connections explains how to make connections.
To get a general impression of the quality of a power system use MONITOR. The
MONITOR key displays a screen with Bar Graphs that show quality aspects of the phase
voltages. A Bar Graph changes from green to red if the related aspect does not meet the
limits. Six different sets of limits can be chosen: a number of them are user
programmable. One of these sets are the limits according to the EN50160 norm. For each
quality aspect submenus with detailed information are attainable via the function keys F1
... F5.
Numerical data is shown by Volts/Amps/Hertz. For this press the MENU key. Then
select Volts/Amps/Hertz and press F5 – OK to display a table with the present values of
voltages (rms and peak), currents (rms and peak), frequency and Crest Factors per phase.
Press F5 – TREND so display the course over time of these values.