


Typical Characteristics Graphs
3-3
Electrical Specifications and Typical Characteristics Graphs
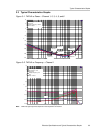
3.3 Typical Characteristics Graphs
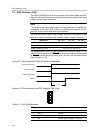
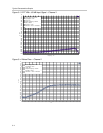
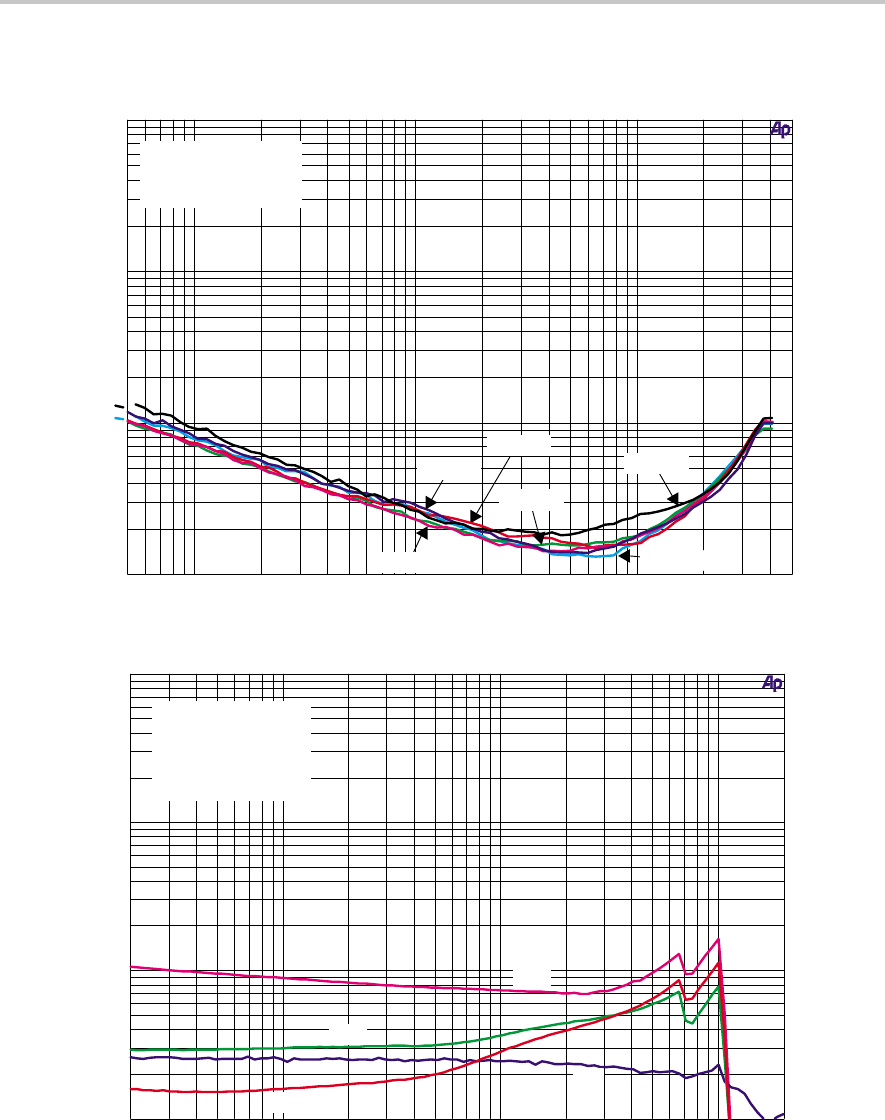
Figure 3–1. THD+N vs Power – Channel 1, 2, 3, 4, 5, and 6
0.01
10
0.02
0.05
0.1
0.2
0.5
1
2
5
%
60m 50100m 200m 500m 1
2
51020
Power Supply = 26.5 V DC
Load = 6 Ω
Sample Frequency = 48 kHz
Filter = AES17
Channel 1
Channel 4
Channel 2
Channel 3
Channel 5
Channel 6
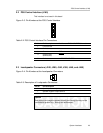
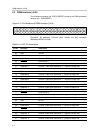
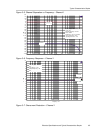
Figure 3–2. THD+N vs Frequency – Channel 1
0.01
10
0.02
0.05
0.1
0.2
0.5
1
2
5
%
20 20k50 100 200 500 1k 2k 5k 10k
Frequency – Hz
Power Supply = 26.5 V DC
Input Signal = 1 kHz
Load = 6 Ω
Sample Frequency = 48
kHz
Filter = AES17
1 W
10 W
20 W
40 W
Note: THD+N at high frequencies depends on the output-filter coil material.