


25
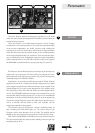
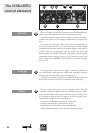
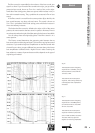
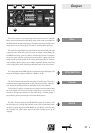
Fig. 8:
Five frequency responses are
shown for the M
ID
-H
I
T
UNE
filter at
max. P
ROCESS
value and
B
ASS
at 0.
1. 1 kHz
2. 2 kHz
3. 3,5 kHz
4. 8 kHz
5. 20 kHz
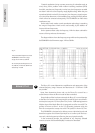
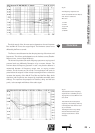
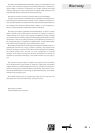
Fig. 9:
The dotted line shows frequency
responses for a soft Bass (S
OFT
)at
varying P
ROCESS
and a M
ID
-H
I
T
UNE
of 3.5 kHz.
The solid line shows the phase
responses, which always drift only
a few degrees if the P
ROCESS
inten-
sity is increased.
The diagram shows very clearly
that the mid attenuation gets
stronger as the P
ROCESS
value
increases.
The VITALIZER's control elements
The third control of the VITALIZER section determines the ratio between
B
ASS and MID-HI TUNE to the original signal. The HARMONICS control is not
affected by the P
ROCESS control.
The P
ROCESS control determines the damping intensity of dominant mid
frequencies. This allows rapid adaptation to the loudness curves (Fletcher-
Munson curves, curves of equal loudness).
The human ear perceives the audio frequency spectrum at varying sound
pressure levels very differently. Perception is by no means »linear«. The
V
ITALIZER alters the frequency spectrum in such a way that the balance is
maintained between all frequency ranges even at varying monitor
volumes. For the human ear, the sound is more pleasant and easier to
perceive than the original. In other words, increasing the P
ROCESS value also
increases the intensity of the M
ID-HI TUNE filter and the BASS filter, whilst
dominant mid frequencies are damped by amplitude-controlled phase
shiftings. This improves the perception of loudness, clarity and the bass
punch, i.e. the strength and fullness of the audio signal.
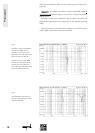
19
Process
1
2 3 4
5