


14
How to Interpret the Graphs
As explained in
Things you can accomplish with this application
on page 2, you can use the graphs
displayed in this application to choose the optimum time period for auto EQ setup with the receiver’s
Advanced EQ Setup function, and to check the effectiveness of steps you take to improve the acoustics of
your listening room.
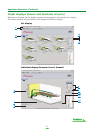
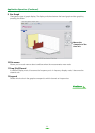
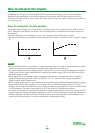
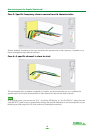
How to interpret reverb graphs
The graphs show changes in microphone input level along a time axis, beginning from a state of quiet at
time 0, when test tones begin to be output, and continuing while a constant level of sound is output from
the speakers.
• If there is absolutely no reverberation in your room, the graph will look like figure A below.
• If there is reverberation, the graph will show a gradual accumulation of acoustic power, as shown in figure
B.
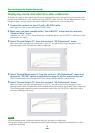
Notes
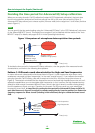
• Due to an effect known as “group delay”, lower frequencies may take longer to be generated than higher
frequencies (this is most obvious when comparing the frequencies around 0 ms).
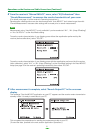
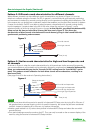
• If a graph extends beyond the display range, or almost fills it, you can change the display by using the Z
(Zoom) control on the graph adjustment bar, adjusting the display range of the Level [dB] scale so that
the whole graph is visible.
• Since channel level and speaker distance settings are displayed in the graphical output, it is best to
make sure these settings (made in the Auto MCACC “ALL” or “Channel Level” setup) are adjusted
properly before reverb measurement.
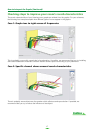
• Even in cases where there is a great difference in the output levels of different frequencies (the frequency
characteristics of the room are poor), you can select ALL CH ADJUST (default) from the “EQ Type”
setting in the receiver’s Auto MCACC setup to bring the frequency characteristics for each channel closer
to a flat response. (For details, see pages 34 to 35 in the receiver’s Operating Instructions.)
• It is usually not possible to calculate the equalization values employed by the receiver’s Acoustic Cal EQ
function simply by viewing the graphs displayed on your PC. (This is because the automatic adjustments
made by Acoustic Cal EQ function take account of factors such as equalization band interference and
analytical filter characteristics, to achieve the optimum characteristic profile.)