


Philips Semiconductors Product data
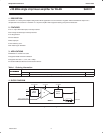
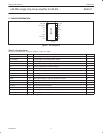
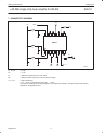
SA2411+20 dBm single chip linear amplifier for WLAN
2003 Feb 07
13
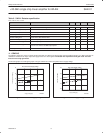
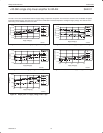
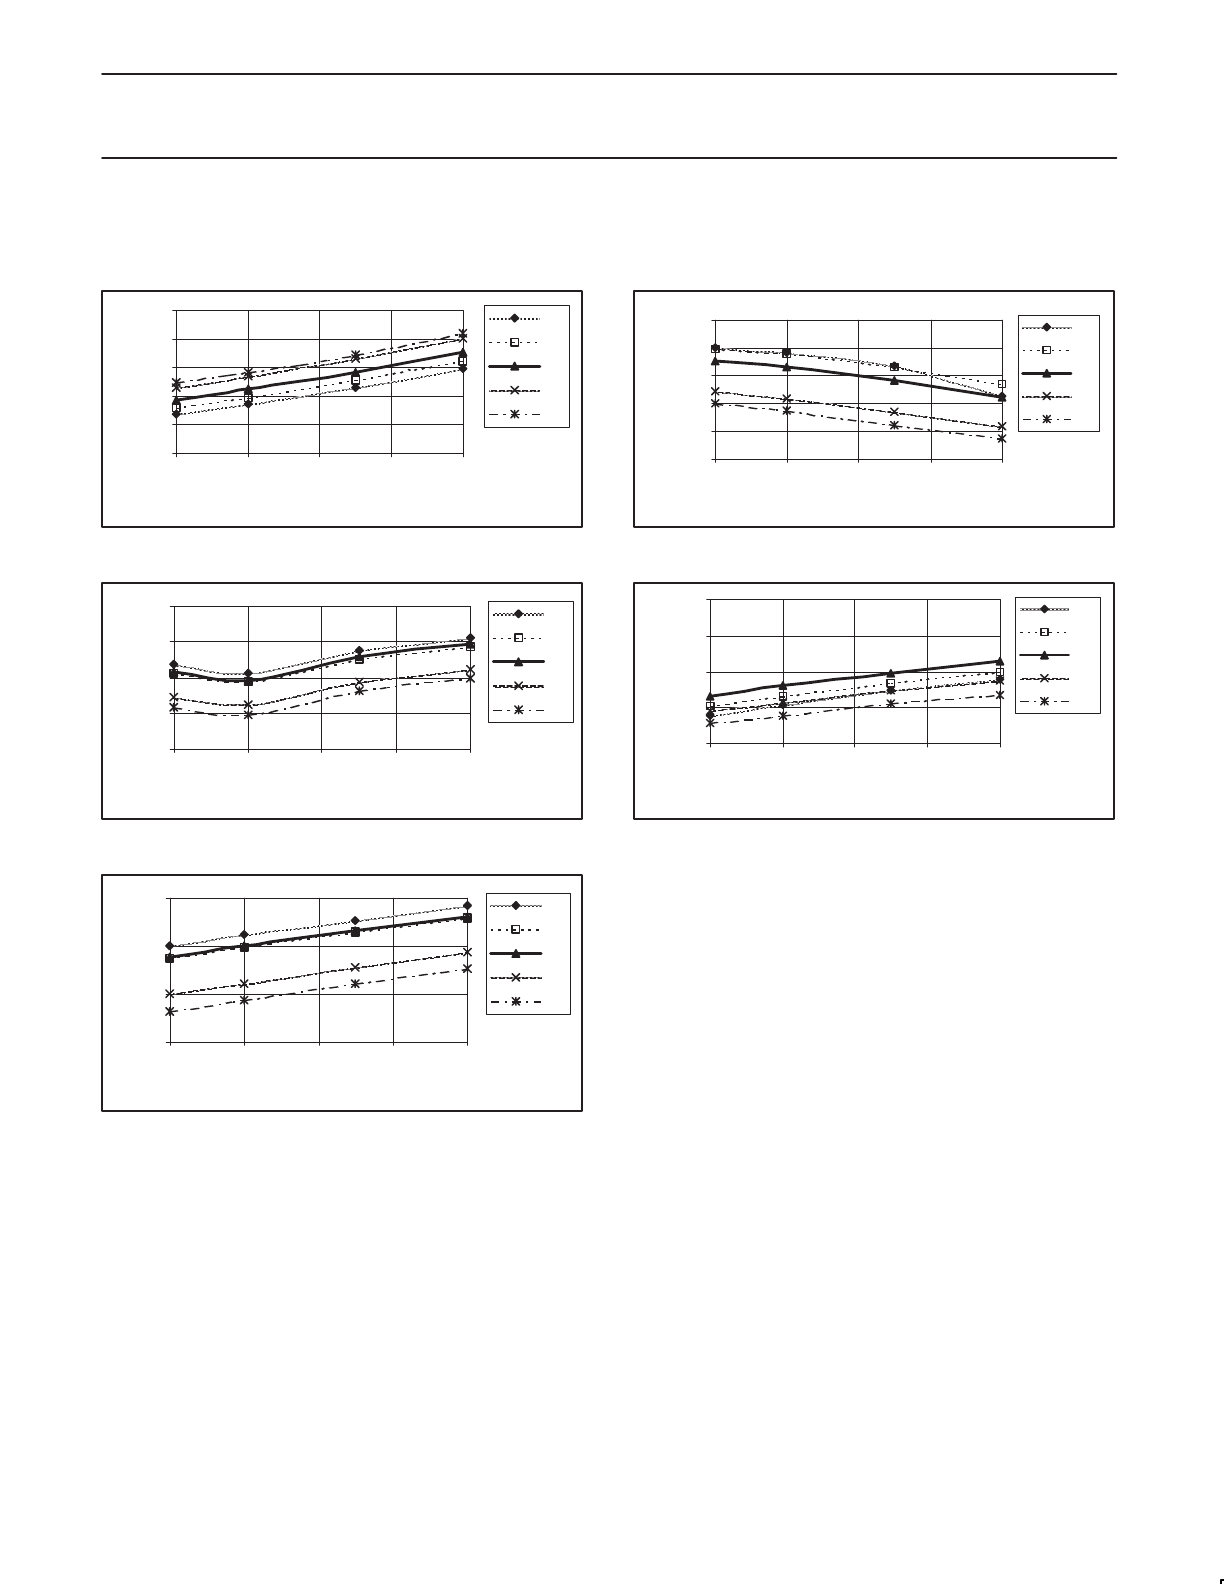
The last 5 curves are characterization data for supply voltage, temperature and power. The worst-case scenario is the combination of highest
temperature/lowest supply. The best-case scenario is the combination of lowest temperature and highest supply voltage. The data has been
taken using a non-modulated carrier at 2.5 GHz.
SR02481
25.00
30.00
35.00
40.00
45.00
50.00
2.8 3.0 3.2 3.4 3.6
Supply Voltage [V]
DC current [mA]
–30
0
25
70
85
Figure 20. DC current vs. supply voltage, mode = high
SR02482
13.00
14.00
15.00
16.00
17.00
2.8 3.0 3.2 3.4 3.6
Supply Voltage [V]
Gain [dB]
–30
0
25
70
85
Figure 21. Gain vs. supply voltage, mode = high
SR02483
17.00
18.00
19.00
20.00
2.8 3.0 3.2 3.4 3.6
Supply Voltage [V]
Pout [dBm]
–30
0
25
70
85
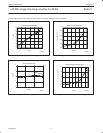
Figure 22. Output power vs. supply voltage, mode = high
SR02484
20.00
22.00
24.00
26.00
28.00
30.00
2.8 3.0 3.2 3.4 3.6
Supply Voltage [V]
Efficiency [%]
–30
0
25
70
85
Figure 23. Efficiency vs. supply voltage, mode = high
SR02485
–0.50
–0.25
0.00
0.25
0.50
2.8 3.0 3.2 3.4 3.6
Supply Voltage [V]
Detector Error [dB]
–30
0
25
70
85
Figure 24. Detector error vs. supply voltage, mode = high