


Clone, except that the overall EQ will be shown in a single graph and the CPU
usage will be that of only a single instance.
Please note that to switch from Capture to Add Mode, or vice-versa, you must
first go through Hold mode.
F
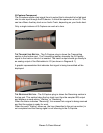
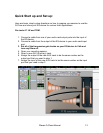
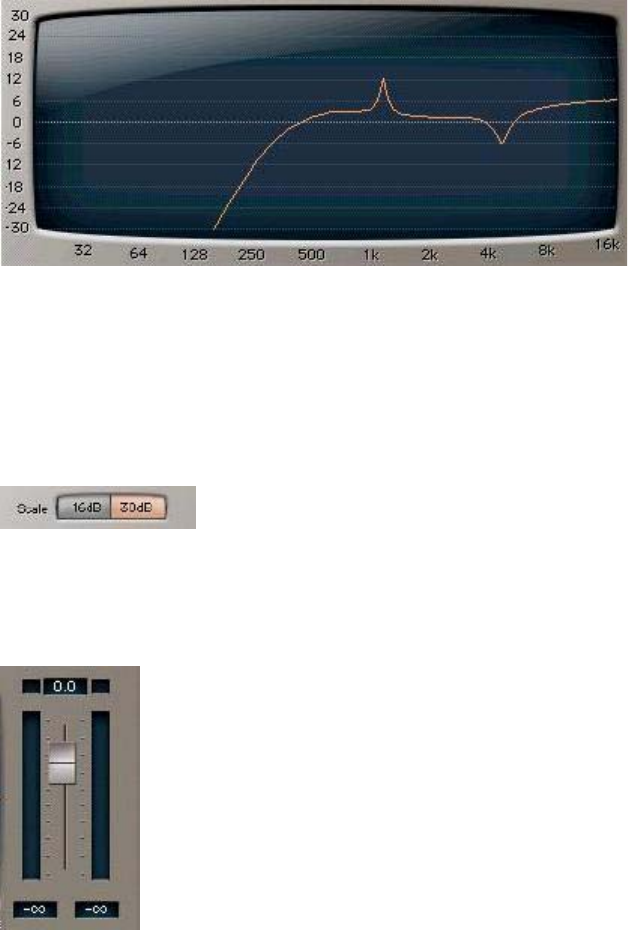
REQUENCY RESPONSE GRAPH
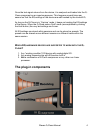
The larger part of the Q-Clone GUI shows a frequency response graph.
It has a logarithmic frequency scale in the horizontal showing 25 Hz to 16 kHz
and Gain in the vertical axis showing +/- 16dB or +/- 30dB.
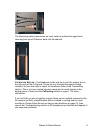
GRAPH SCALE CONTROL – The Graph Scale Control allows you to choose either
+/-16 gain or +/-30dB gain as the scale of measurement for vertical axis of the Q-
Clone component.
G
AIN FADER - The Gain control is a continuous fader going from -48dB to +12dB.
The default setting is 0dB.
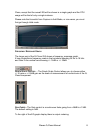
To the right of the EQ graph display there is output metering.
Waves Q-Clone Manual
8