


Electro-Voice® EVA Series User Manual 9
3.0 Designing an EVA Array (cont’)
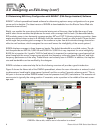
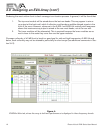
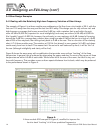
Figure 4 shows the EVADA Main tab, where the array is built and its performance evaluated in the three
frequency bands mentioned above. This tab is full of information and things to enter:
1. In the top middle of the view is where the number of suspension points (one or two, front to
back), array trim height and distance downstage from front of rig are chosen. Regarding trim
height, be sure to allow for the height of the lifting mechanism(s) and attachment points.
2. At the top right of the view is where the three frequency bands and their bandwidths are
shown. The default bandwidth is 0.33 octave and the default frequencies are 3,000 Hz, 500
Hz and 8,000 Hz. These can be changed by the user.
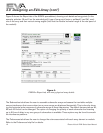
3. The Loudspeaker Stack column and table at the upper left allows the user to (1) pick the
standard or extended grid (click on the default grid cell to access a selection menu), (2)
adjust the grid tilt angle, and (3) pick any of the four EVA modules up to eight in number.
The HF Attenuator column contains cells which show the effect of the internal 3-dB high-
frequency attenuator (high-frequency shading): no attenuation or attenuation of either the
upper or lower high-frequency driver pair. The Optional Attenuator column contains cells
which show the effect of the optional EVA-AM attenuator module: 0 dB (not installed), or 3
dB, 6 dB or 9 dB (installed).
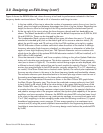
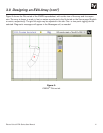
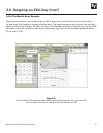
4. Once the elements of items 1 and 3 are complete, clicking on the yellow Update Prediction
button will calculate array performance. This button appears in the Main Cluster geometry
view (one is shown in Figure 9). The module vertical aiming angles are also displayed, with
a different colored, slightly splayed line pair for each module (as noted in Section 1.0, there
are two line-array elements in each EVA module, vertically splayed by 3° or 10°, depending
on model). If the Show Polars box is checked under Options, the vertical polar responses of
the array are also shown in this area, in the three frequency bands and bandwidths chosen.
The acoustic reference point described earlier is the small plus sign shown near the rear of
the seating area (approximately on the lower yellow module-aiming line).
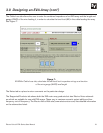
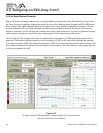
5. The most important predicted information is shown in the Main Cluster SPL graph below
the Main Cluster Geometry view. This shows the predicted coverage uniformity front (left)
to back (right) in dB, where 0 dB is the value shown in the upper right-hand corner of the
Main Cluster SPL view. (In Figure 4, this value is 112 dB SPL.) Note that SPL prediction is
a complex function of the array maximum output versus frequency, the spectral distribution
and peak-to-average ratio of the program material, the dynamic peak capability of the power
amplifiers, and room acoustics. However, the EVADA calculated SPL value has been found
to be close to the peak indications, e.g., peak pointer readings, on a sound level meter with
C or F (flat) weighting in its fast averaging mode under the following conditions: (1) typical
broadband contemporary music program, (2) two arrays operating in a reverberant envi-
ronment and (3) using the power amplifiers recommended in the engineering data sheets
(available at www.electrovoice.com). (A one-array design would reduce the predicted SPL
by 3 dB.)