


Page 23
7.14 Output Control
This control allows you to normalize the output level to 0VU after the processing is set up. It
will usually get set around 12 o’clock, but there is a plus or minus 10dB range available which
is useful if you need to match a slightly odd level.
7.15 Process Switch
This operates a bypass relay which completely bypasses the Compellor in the process out
mode. The relay will also go to bypass if the power is shut off or the power supply fails. This
is a life saver in cases where the program must never be lost such as broadcast chains or
live performances.
7.16 Input/Output
The Compellors use the Aphex active servo balanced input and output stages. We like to
specify pin 2 as positive but this is purely arbitrary since the balanced input and output pins
are directly in phase and there is no dedicated unbalanced output which would be specified in
relation to the input phase. You could just as well call pin 3 positive if that is what you want.
7.17 Operating Levels
A rear panel rotary switch for each channel selects the normal operating level for the
Compellor. You can chose -10dBV, +4dBu, and +8dBu as the reference level. This switch
sets the dynamic range of the Compellor’s circuitry to best match your standard operating
level, and also sets the 0dB calibration of the front panel audio level meter to equal the refer-
ence level selected.
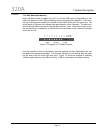
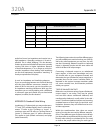
7.18 Input/Output Metering
si retem DEL roloc-ib eht ,tuptuO ro tupnI rehtie otni delggot si nottub tceleS reteM eht nehW
programmed to indicate a bar graph from left to right. Within the bar graph is a red portion
and a green portion. The red portion indicates the VU or “average” level and the green por-
tion indicated the peak level of the signals. Figure 9-1 shows an example of an audio level
indication showing a zero VU signal with a peak level of +9dB.
This would translate to an average signal level of +4dBu with a peak value of +13dBu if the
Compellor were normalized to +4dBu. Note that, since the peak value is always greater than
the average value of an audio signal, the green bar always appears to the right of the red
bar.
Figure 7-1 Bargraph Level Meter Example
6 Reds 3 Greens
2
-15
4 6 8 10 12 14 16 18 20
-12 -9 -6 -3 0 3 6 9 12
G.R. (dB)
PGM (dB)