7
PAZ Plug-in Manual
channel at different times.
In these examples, the ears do not hear a disturbing ‘out-of-phase’ sound. For us to hear an out-of-phase sound,
there generally needs to be a consistent opposite polarity over a period of time, which the meter will show.
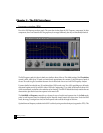
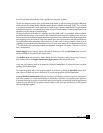
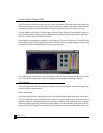
The Stereo Position Display analysis takes this into account. Still there will be occasional fast spikes in the anti-
phase region, and you can ignore them if they are not consistent, especially if you know you are using stereo delay or
similar effects. You might be really bothered if the energy in the out-of-phase region is consistently significant
compared with the energy of the ‘in-phase’ region.
It is advised that you take the time to explore how the SPD looks when you intentionally flip the phase on one
channel of a stereo signal. (You can do this by using the Q1 or one of the S1 components in front of the SPD).
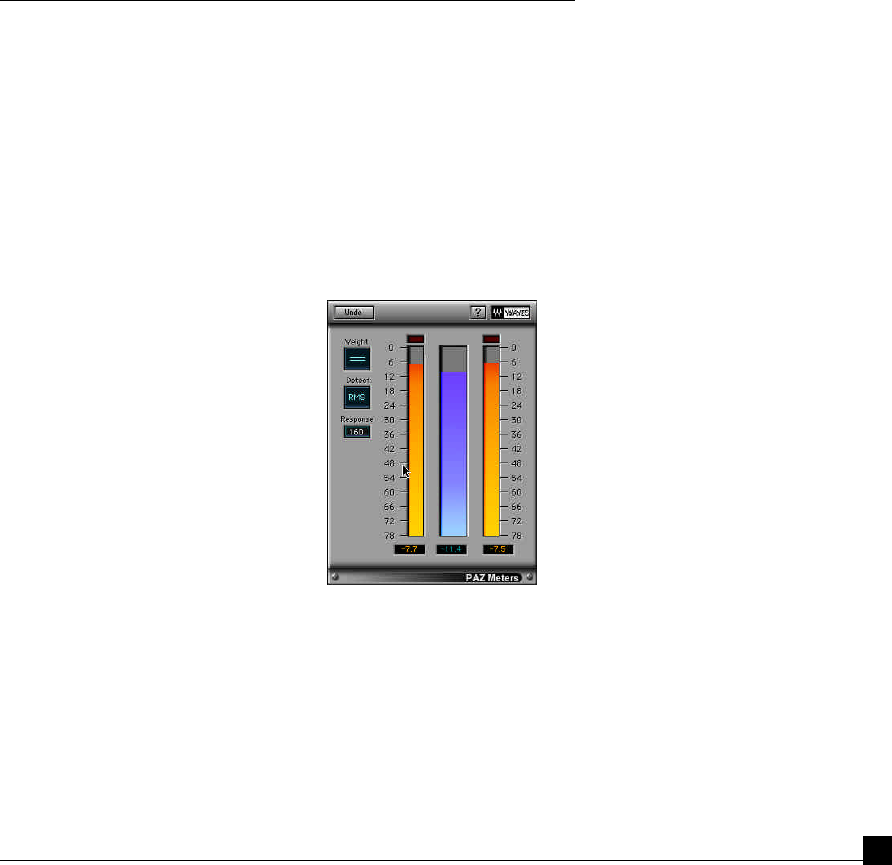
Level meters
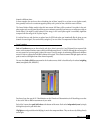
Peak and Loudness meters are shown beside each other; when in stereo, the L and R channels have separate Peak
meters, with a summed Loudness meter which has 6dB subtracted from it (L+R-6dB). Although the true energy the
ears are exposed to by stereo signals is indeed the sum of L and R energies, by subtracting 6dB from the loudness
meter, it’s easier to evaluate the Peak/RMS relations of the signal. This is because summed left/right signlas can have
peaks as much as 6dB higher than either channel separately.
You can sel ect Peak or RMS measurement for the Loudness meter, which is also affected by the selected weighting
curve (unweighted, dBA, dBB, dBC).
For those of you who own the L1-UltraMaximizer or the L2 hardware Ultramaximizer, it will be striking to see what
it does to the Peak-to-RMS measurements of your audio.
Each of the 3 meters have peak-hold values at the bottom of the meter. Each can be independently reset by simply
clicking directly on the peak hold value.
Clip lights are only provided on the full plug-in, not in the component Meter. They can be reset by clicking directly
on the light.


