


5
PAZ Plug-in Manual
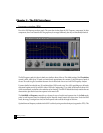
lets each band update independently as fast as possible for its frequency resolution.
The real-time frequency analysis can be used for mono, dual channel, or total stereo energy by using the LR button,
which switches between dual channel (L/R, independent channels) and total stereo energy (L+R). The L+R mode
is not a simple summation of L and R signals, but of L and R energies. This more closely models our ears’ responses
to loudness of frequencies, as the gain and pan position of a sound are independent. The dual channel mode may be
selected for precision analysis or troubleshooting.
The display can also be set for either of 3 weighting curves (dBA, dBB, or dBC), or unweighted. When unweighted,
the absolute ‘electrical energy’ values are shown. Like in standard loudness meters, the weighting curves can be used
for noise and loudness measurement applications that require them. Precise definitions of the monitoring levels for
these weighting curves are beyond the scope of this manual, but in short, low frequencies offer little contribution to
the overall loudness when monitoring at low sound levels. In other words, we are less sensitive to them. So an ‘A’
weighting is used which reduces the contribution of these LF to the meter reading. ‘B’ is for intermediate levels, and
‘C’ is nearly flat, for high level monitor loudness measurements. Unweighted is for precise, “what you see is what is
there”, measurements.
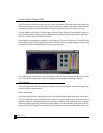
Option-dragging in the Frequency window will zoom the selected area. Click the Reset Zoom button to reset to
maximum display of all frequencies and dynamic values.
The crosshair cursor can be shown by simply clicking once in the Frequency window. You can drag it around or
click anywhere to show it. Drag the crosshair to the upper corners to hide the crosshair cursor.
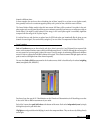
At any time, the Frequency graph can be stopped by clicking the Freeze button. To release and return to realtime
graphing, click the button again.
The maximum graphed value of the Frequency analysis can be shown by clicking the Show/Hide button. Maxi-
mum values are tracked even when in Hide mode. To reset the max graph line, click the Clear button.
A note on Pink Noise measurements: Pink noise is defined as noise that has constant energy inside any frequency
band with a constant Q (i.e. frequency/bandwidth=a constant value). Pink noise is an important audio signal since
it represents the average spectrum of a typical audio signal, and because the ears analyze the sound in approximately
constant-Q bands. Because PAZ has almost constant-Q bands, a pink noise input will show up as a flat spectrum
when no weighting is applied.