


PAZ Plug-in Manual
4
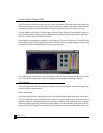
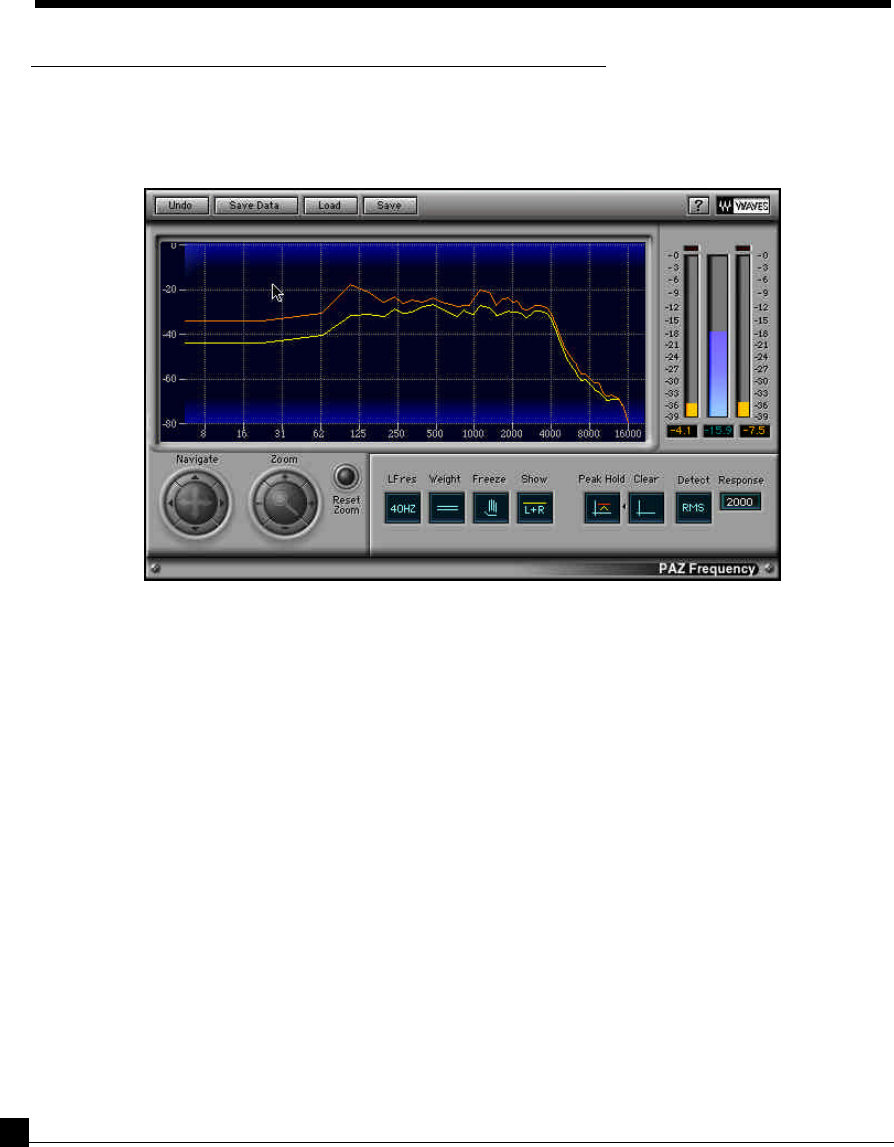
Frequency window (RTA)
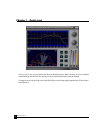
Here is the PAZ frequency analyzer graph. The screen shot is taken from the PAZ-Frequency component. In other
components, the row of buttons below the graph may be arranged differently, but they are functionally identical.
The PAZ frequency analysis is done in bands very similar to those of the ear. The default setting of the LF resolution
control is 40Hz, which gives 52 bands, and most closely approximates the constant-Q critical frequency bands of
the ear. The result is a good correlation between what we heard and what we see in the PAZ frequency analyzer.
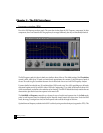
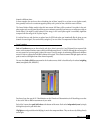
For more detailed or technical uses, LF resolution below 250Hz can be set to 20 or 10Hz, providing up to 68 bands;
the button’s options are 40, 20, and 10Hz. Above 250Hz, the “engineering Q” (or width) of the bands are about 10.0,
which as mentioned, are similar to the resolution of our hearing. The 40Hz LF default also closely matches the ears
characteristics, plus has the best time response in the meter itself.
The Peak/RMS and Response controls let you choose the type of analysis and response time. In the Peak mode,
peaks in each frequency band are displayed and the Response simply controls the release time. Under the RMS
mode, the energy is averaged over time, and the Response value controls the length of this time.
Optimal time and frequency resolution in the PAZ is achieve by using wavelet techniques (as opposed to FFTs). This
Chapter 3 - The PAZ interfaces