


SV Sound
Page 14
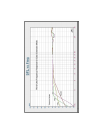
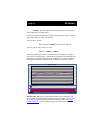
Sine wave audio tools typically allow the user to play individual tones, say 10Hz
through 98Hz in one hertz increments allowing very good resolution over your
measurements. When measuring the room’s response use a minimum resolution of
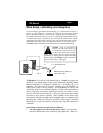
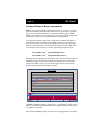
5Hz. Figure 3 on the previous page shows a theoretical illustration of a room’s
response. Again, exercise extreme caution with the length of time and keep to very
moderate SPLs or damage to your subwoofer’s voice coil will occur!
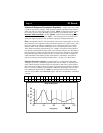
Before you plot your results however, it’s important to note the Radio Shack sound
meter is not totally "linear" in its accuracy down low. All similar meters are off by
the similar amount depending on the frequency; so while its sensitivity below 20Hz
is not what it is at 50Hz, there is a simple way to compensate for this deficiency. It's
called a compensation chart.
Simply look to the below frequencies and add the required decibels (dBs) at the fre-
quency in question. So if your system seems to be measuring 70dBs with a 20Hz
tone, then really it's putting out 77.5dBs. This is a very substantial difference,
roughly TWICE the acoustical energy, requiring several times the amplifier power to
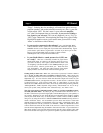
achieve. You can see then how critical the below chart is
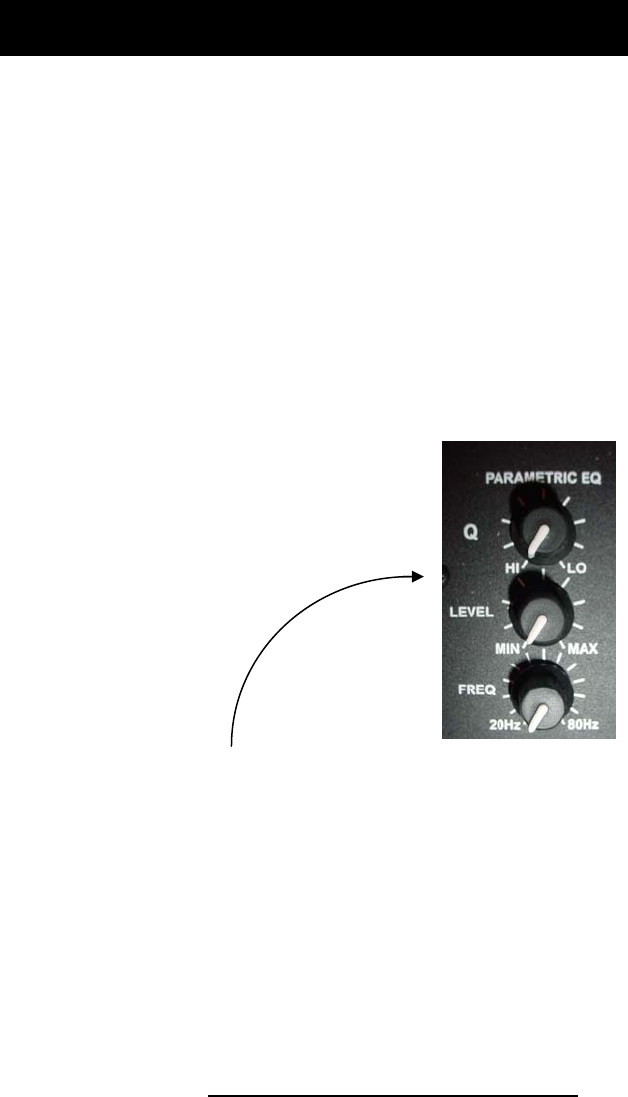
if you are using your PEQ to even out or “flatten” the
room response of your bass (Note: control layout may
differ on your amplifier functions and labels are constant).
Add the following to your measurements:
10Hz add 20dBs
12Hz add 16.5db
16Hz add 11.5dB
20Hz add 7.5dB
25Hz add 5dB
31.5Hz add 3dB
40Hz add 2.5dB
50Hz add 1.5dB
63Hz add 1.5dB
80Hz add 1.5dB
100Hz add 2dB
125Hz add .5dB
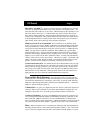
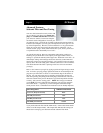
Explanation of the controls. Now that we have discussed how to measure the
room’s response, the next step is to correct the problem areas with the parametric
equalizer. Before we start turning the controls we need to understand what the ad-
justments are and how they work.
“Q”. This control determines how wide the correction will be. Each “hash mark” on
the amp’s front plate represents 0.1 octave adjustments. The “HI” mark is equal to
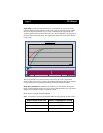
0.1 octave (narrow) and “LO” mark is equal to .9 octave (wide). In Figure 3 the
highest peak is located at 40Hz and becomes flat again at 50Hz (the Highest Fre-
quency of the peak). To determine the Q adjustment the following formula is
needed. More on “Q” in a moment.
Formula 1 (Highest Frequency [X] – Center Point [Y])
Center Point (Y)
SVS PEQ Controls