


SV Sound
Chapter 8-3
To set the overall test level, play a 25 Hz frequency and adjust the sub-
woofer gain (option 1 below) or the processor master volume (option 2
below) until the SPL meter reads about 75 dB at the listening position.
Run each tone only long enough to get a stable reading from the meter
(about 5-6 seconds), and then give the subwoofer about 10 seconds to
cool off between test frequencies.
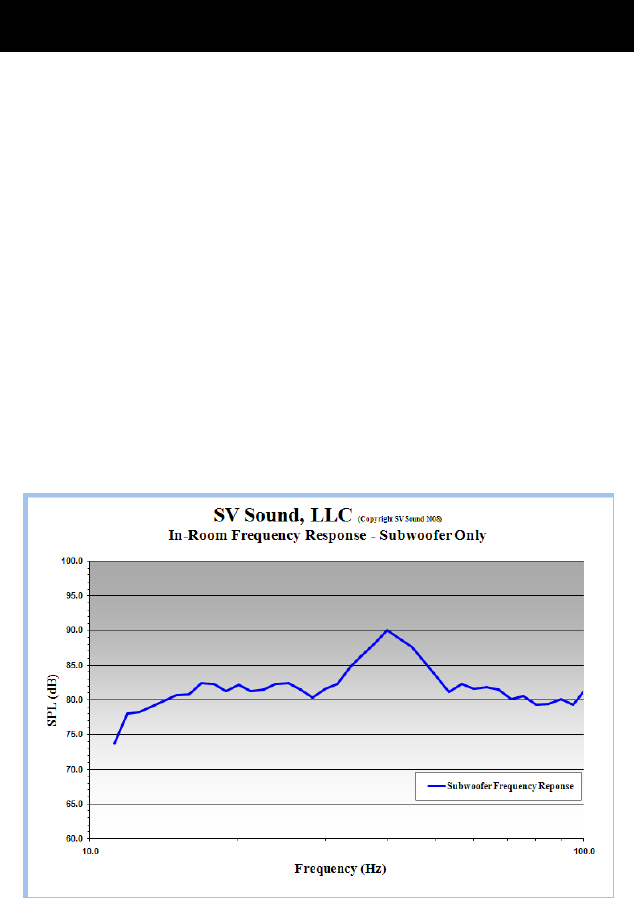
Option 1: Measure The FR of the Subwoofer Only:
To measure the FR of the subwoofer only, connect your sound card out-
put directly to a line level input on the subwoofer. Use the Excel spread-
sheet named Subwoofer Frequency Response, which will plot the fre-
quency response of the subwoofer from 11.2 Hz to 100.8 Hz. Input your
raw (direct read) values from your SPL meter into the green band of fre-
quencies in the Raw SPL Data worksheet, and the Frequency Response
worksheet will plot the FR of the subwoofer.
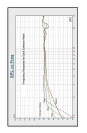
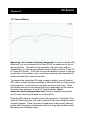
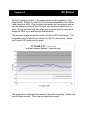
Below is an example of a subwoofer FR. Notice the large peak from 35-
55 Hz.
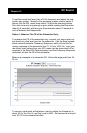
To correct a peak such as that above, start by setting the Frequency to
about 40 Hz, the Q to HI, and the Level to MAX. Re-measure and re-plot
from 30-70 Hz to evaluate the effect.