


Two 2k deep waterfall buffers ensure you’ll never
miss important waterfall data.
The SR785 doesn’t limit you to a few preselected
measurements. With user math you can create an
infinite variety of measurements.
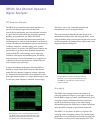
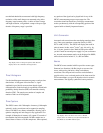
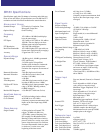
Waterfall
Waterfall plots are a convenient way of viewing a time history
of your data. Each successive measurement record is plotted
along the z-axis making it easy to see trends in the data. All
FFT, octave and order tracking measurements can be stored in
the SR785's waterfall buffer memory. You can choose to save
all measurements and averaging modes or just the current
measurement to conserve memory. Waterfall traces can be
stored every n time records for FFT and order tracking
measurements. For order tracking measurements new records
can be acquired at a specific time interval or change in RPM.
In octave measurements, the storage interval is in seconds (as
fast as every 4 ms). While displaying waterfall plots, you can
adjust the skew angle to reveal important features, or change
the baseline threshold to eliminate low-level clutter. Any
z-axis slice or x-axis record can be saved to disk or displayed
separately for analysis.
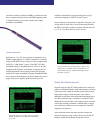
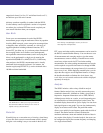
Analysis
The SR785 includes a wide variety of built-in analysis
features. Marker analysis lets you easily measure the power
contained in harmonics, sidebands or within a given band of
frequencies. Important information such as THD, THD+N,
sideband power relative to a carrier, or total integrated power
are calculated in real-time and displayed on the screen. The
front/back display feature allows you to display live data from
both signal inputs on one graph. You can also simultaneously
display saved traces and live data. The peak-find marker
allows you to quickly locate frequency peaks with the click of
a button. The marker statistics feature calculates the
maximum, minimum, mean and standard deviation of data in
any section of the display. For modal analysis, the cursor can
be configured to display the resonant frequency and damping
of a single selected mode.
output levels from 0.1 mV to 5 V and offsets from 0 to ±5 V,
and delivers up to 100 mA of current.
Arbitrary waveform capability is standard with the SR785.
Use the arbitrary source to playback a section of a captured
waveform, play a selected FFT time record or upload your
own custom waveform from your computer.
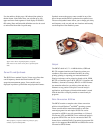
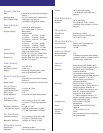
User Math
Create your own measurement in each of the SR785's
measurement groups using the math menu. Enter any equation
involving RMS averaged, vector averaged or unaveraged time
or frequency data, stored files, constants, or a rich array of
supplied operations including arithmetic functions, FFT,
inverse FFT, jω, d/dω, exp, ln x, and many others. Because all
the averaging modes are available as user math operands,
non-repeatable runout measurements (used in analyzing disk
drives) can be performed in a single pass by entering the
equation MAG(RMS<F1>)-MAG(Vec<F1>). Unlike many
other analyzers, the SR785's measurement rate is virtually
unaffected when user math is selected. For instance, the
function exp(ln(conj(FFT2/FFT1))) can be calculated with a
100 kHz real-time bandwidth.