


provided to monitor variations of RPM as a function of time.
And a complete selection of time and RPM triggering modes
is included allowing you to make virtually any rotating
machinery measurement.
Swept-Sine Measurements
Network analysis using FFT mode produces fast results but
suffers from limited dynamic range and frequency resolution.
Swept-sine mode is ideal for network analysis that involves
high dynamic range or wide frequency spans. Gain is
optimized at each point in the measurement producing up to
145 dB of dynamic range. A frequency resolution of up to
2000 points is also provided. Auto-ranging can be used with
source auto-leveling to maintain a constant input or output
level at the device under test (to test response at a specific
amplitude, for instance).
Auto-resolution ensures the fastest possible sweeps and
adjusts the frequency steps in the scan based on the DUT’s
response. Phase and amplitude changes that exceed
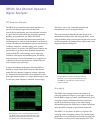
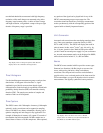
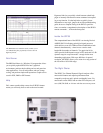
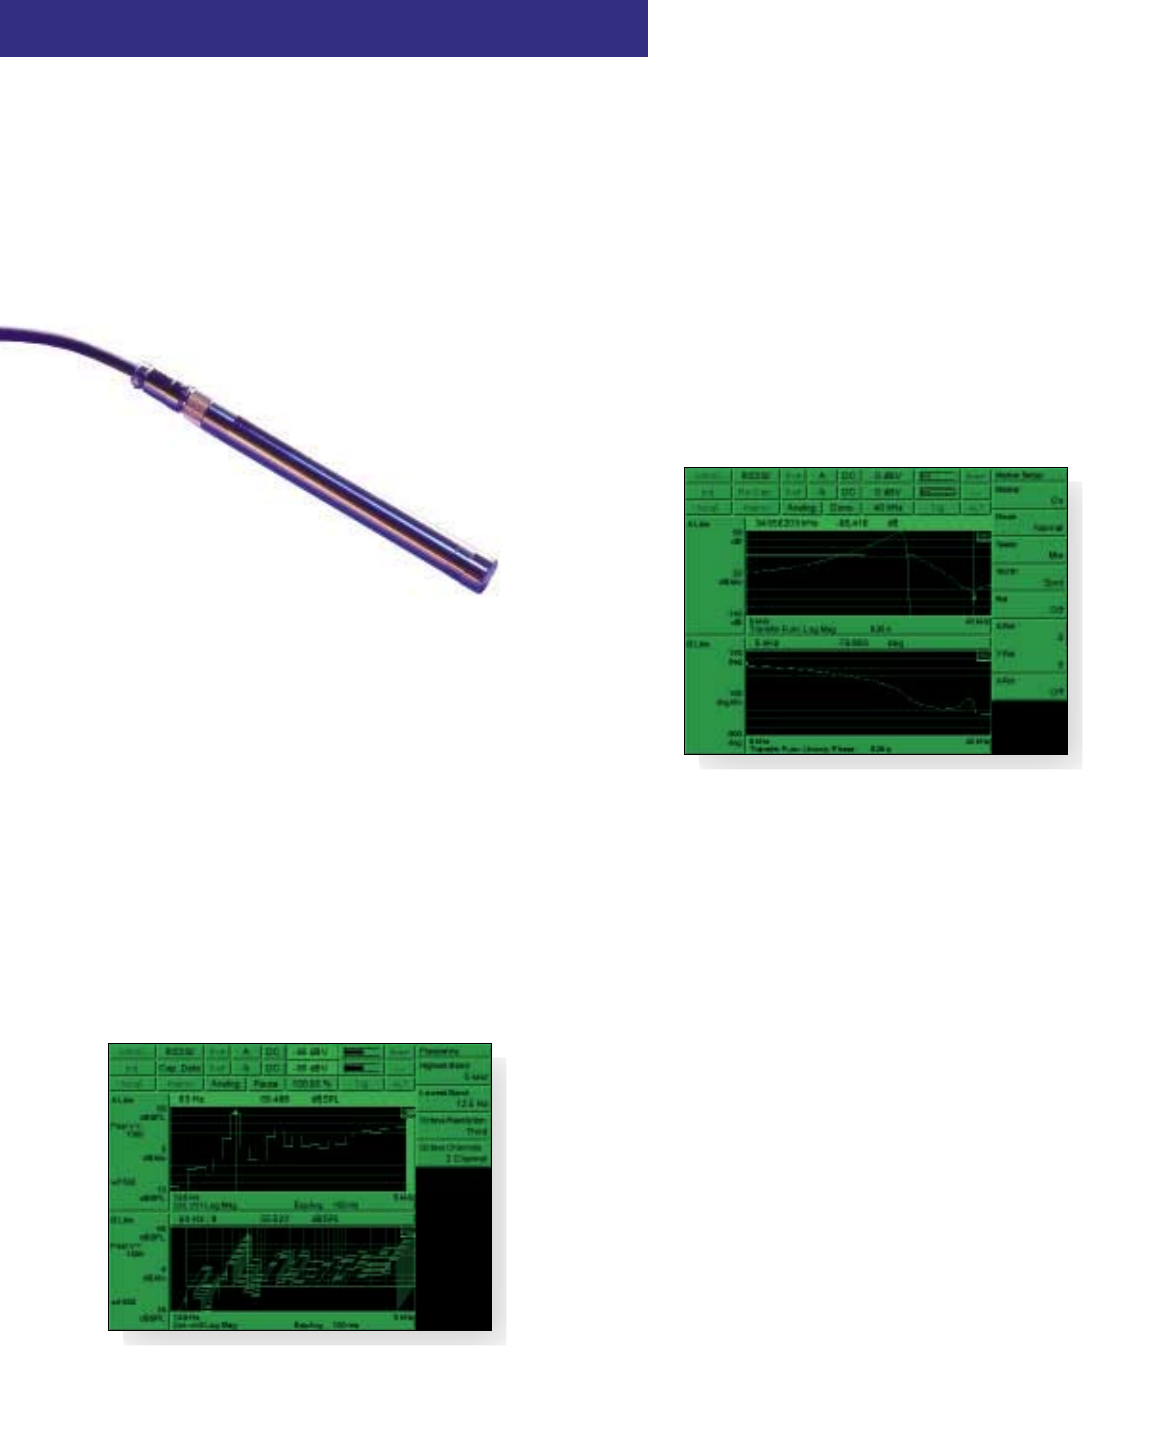
Swept-sine Bode plot of lowpass filter response. Top
display shows magnitude with an expanded view of
the passband response, while bottom display shows
the phase response.
Octave Analysis
Real-time 1/1, 1/3, 1/12 octave analysis at frequencies up to
40 kHz (single channel), or 20 kHz (2 channel) is a standard
feature of the SR785. Octave analysis is fully compliant with
ANSI S1.11-1986 (Order 3, type 1-D) and IEC 225-1966.
Switchable analog A-weighting filters as well as A, B and C
weighting math functions are included. Averaging choices
include exponential time averaging, linear time averaging,
peak hold and equal confidence averaging. Broadband sound
level is measured and displayed as the last band in the octave
graph. Total power, impulse, peak hold and Leq are all
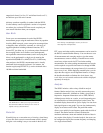
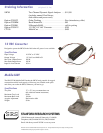
Expensive options are a thing of the past with the
SR785. Real-time octave analysis is standard on
every unit.
available. Exponentially averaged sound power (Leq) is
calculated according to ANSI S1.4-1983, Type 0.
Octave displays can be plotted as waterfalls with a fast 4 ms
storage interval. Once data is stored in the waterfall buffer,
the SR785 can display centile exceedance statistics for each
1/1, 1/3 or 1/12 octave band as well as for Leq.