


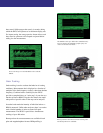
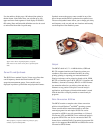
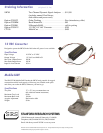
Top display shows the burst noise source. Bottom
display shows an arbitrary waveform downloaded to
the SR785 via the IEEE-488 interface.
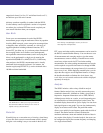
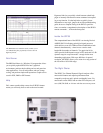
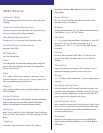
Top display shows a histogram of time data. Bottom
display shows the cumulative density function.
user-defined thresholds are measured with high frequency
resolution, while small changes are measured using wider
frequency steps between points. A choice of linear sweeps
with high resolution, or logarithmic sweeps with up to eight
decades of frequency range is provided.
Unit Conversion
Automatic unit conversion makes translating transducer data
easy. Enter your transducer conversion directly in V/EU,
EU/V or dB (1V/EU). The SR785 will display the result in
units of meters, inches, m/sec
2
, in/sec
2
, m/s, in/s, mil, g, kg,
lbs., N, dynes, pascals or bars. Built-in ICP
®
power means
you don’t need an external power supply for your accelerome-
ter. Acoustic measurement results can be displayed in dBSPL,
while electrical units include V, V
2
, dBV and dBm.
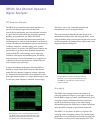
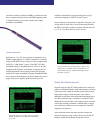
Source
The SR785 comes standard with five precision source types.
Generate low distortion (-80 dBc) single or two-tone sine
waves, white noise, pink noise, chirps, and arbitrary
waveforms. The chirp and noise sources can be bursted to
provide activity over a selected portion of the time record for
FFT measurements, or to provide impulse noise for acoustic
measurements. The digitally synthesized source produces
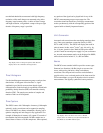
any portion of the signal can be played back in any of the
SR785's measurement groups except swept-sine. The
convenient Auto Pan feature lets you display measurement
results synchronously with the corresponding portion of the
capture buffer to identify important features.
Time Capture
The SR785 comes with 2 Msamples of memory (8 Msamples
optional). Analog waveforms can be captured at sampling
rates of 262 kHz or any binary submultiple, allowing you to
optimize sampling rate and storage for any application. For
example, 8 Msamples of memory will capture 32 seconds of
time domain data at the maximum 262 kHz sample rate, or
about 9 hours of data at a 256 Hz sample rate. Once captured,
Time/Histogram
Use the time/histogram measurement group to analyze time
domain data. A histogram of the time data vs. signal
amplitude is provided for accurate time domain signal
characterization. Statistical analysis capabilities include both
probability density function (PDF) and cumulative density
function (CDF). The sample rate, number of samples and
number of bins can all be adjusted.