


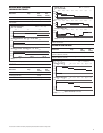
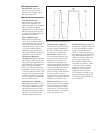

Vertical interval test signals can be seen very clearly for additional analysis of the signal.
These can be printed as support documentation for automatic measurement results.
E
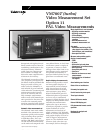
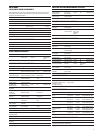
ven a single horizontal synchronization pulse can be displayed at a high intensity.
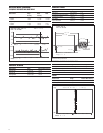
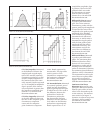
0.5
0.0
Volts
Sound-In-Sync OffSound-In-Sync OffPrecision Mode On Precision Mode On
L18 L19
M
icroSeconds
20.0 40.0 60.0 80.0 100.0 120.0
Sync = SourceSync = Source625 line PAL 625 line PAL Synchronous Synchronous No Filtering No Filtering
APL = 42.5% APL = 42.5%
S
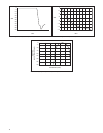
inewave at middle of screen is too small or frequency too low for measurement.
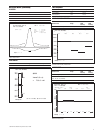
S
inewave at middle of screen is too small or frequency too low for measurement.
0.1
0.0
-0.1
-0.2
-0.3
Volts
Sound-In-Sync On Sound-In-Sync On Precision Mode OffPrecision Mode Off
Time from L to R: 4.703 MicroSecondsTime from L to R: 4.703 MicroSeconds
Frequency (1/T): 0.212647 MHzFrequency (1/T): 0.212647 MHz
L19
MicroSeconds
-1.0 0.0 1.0 2.0 3.0 4.0 5.0
Sync = SourceSync = Source
Vertical delta: -0.256 VoltsVertical delta: -0.256 Volts
Frames selected: Frames selected: 11 22 33 44
625 line PAL 625 line PAL Synchronous Synchronous
Slow clamp to 0.00 V at 6.72 uSSlow clamp to 0.00 V at 6.72 uS
No Filtering No Filtering
APL = 42.1% APL = 42.1%
Noise reduction: 15.05db Noise reduction: 15.05db
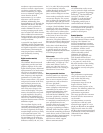
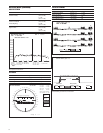
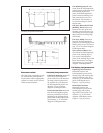
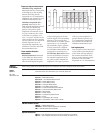
In Vector Mode, the VM700T becomes a digital vectorscope with an electronic graticule.
The “Color Bar Search’’ feature makes it easy to quickly display a line containing a color
bar test signal.
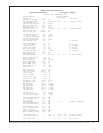
Main Measure Mode display of available measurements.
Sound In Sync ON Sound In Sync ON
V
U
75%
100%
mg
Mg
r
R
yl
Y
l
g
G
cy
Cy
b
B
A
PL = 42.2%
A
PL = 42.2%
System LineSystem Line
A
ngle (deg) 0.0
A
ngle (deg) 0.0
Gain x 1.014Gain x 1.014
0
.125 dB
0
.125 dB
L133 L133
Burst from source Burst from source
Display +V & -VDisplay +V & -V
625 line PAL 625 line PAL
V
U
75%
100%
mg
Mg
r
R
yl
Y
l
g
G
cy
Cy
b
B
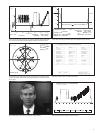
Picture Mode display. (Video courtesy of KOIN-TV, Portland, Oregon.)
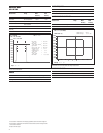
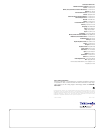
Measure Mode DGDP special position acquisition feature.
Auto
Scan
Auto
Scan
Manual
Steps 5
Manual
Steps 5
RefPacket
35.1uSec
RefPacket
35.1uSec
1st Step
39.9uSec
1st Step
39.9uSec
Last Step
55.9uSec
Last Step
55.9uSec
Measure
Cycles 7
Measure
Cycles 7
ExitExit
Measurement Location for the DGDP MeasurementMeasurement Location for the DGDP Measurement
u secu sec
5.0 10.0 15.0 20.0 25.0 30.0 35.0 40.0 45.0 50.0 55.0 60.05.0 10.0 15.0 20.0 25.0 30.0 35.0 40.0 45.0 50.0 55.0 60.0
Line = 330 (SIS mode)
3