


Page 11
5. Graphical Displays
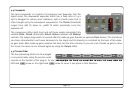
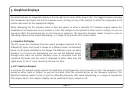
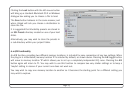
Vocalstrip features an assignable display in the top right hand corner of the plug-in GUI. This toggles between showing
the Compander Law Graph and the EQ response curve. Clicking on any of the controls in either the Compander or EQ
section will switch to the appropriate display.
When displaying the EQ response there is also the option to show a real-time FFT analyser engine reports the
amplitude of all frequencies at any moment in time. The analyser can be placed at either input or output, so you can
see what effect the processing has on the frequency spectrum. The Spectrum Analyser makes it easy to spot an
offending frequency that needs attenuating, or a range of frequencies that require boost.
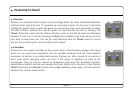
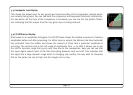
5.1 Graphical EQ Display
The EQ curves are calculated from the actual analogue response of the
different EQ types. Each band is shown as a different colour so individual
bands can be easily identified in the display. The different curves are alpha
blended, so if curves are overlapping one can see the different bands
through each other. An overall response curve is calculated from the
combined EQ bands and the result is displayed in white.
Note here the
slight boost in the LF curve caused by the low cut filter.
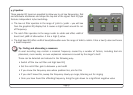
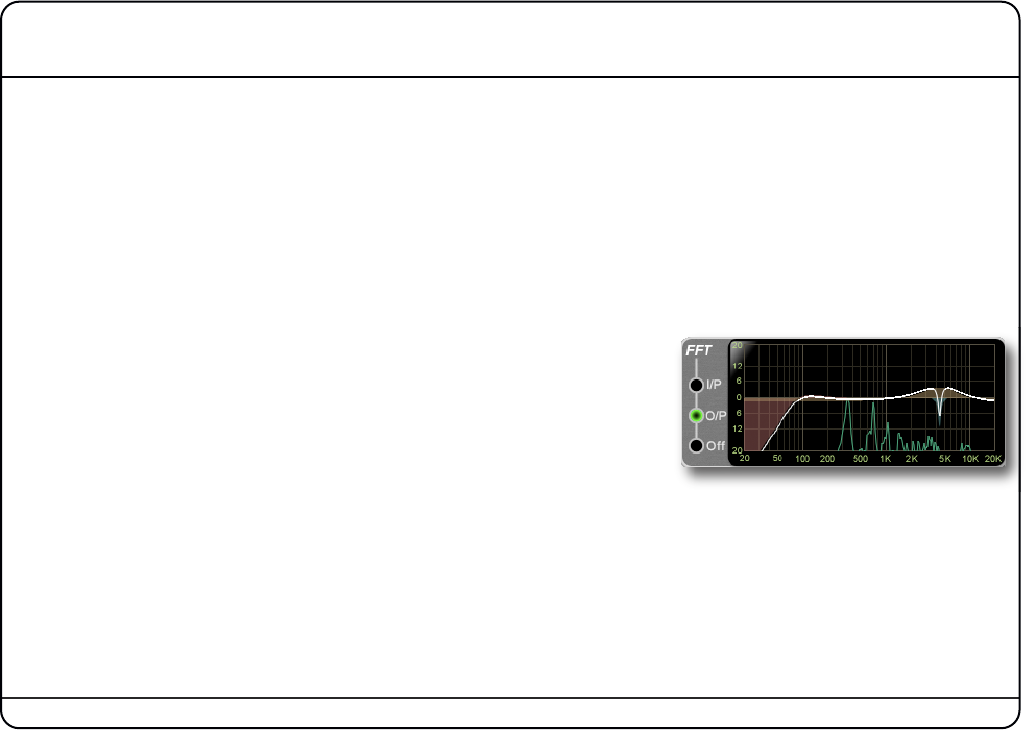
5.2 FFT Spectrum Analyser
A real-time FFT analyser engine reports the amplitude of all frequencies at any moment in time. The analyser can be
placed at either input or output, so you can see what effect the processing has on the frequency spectrum. The
Spectrum Analyser makes it easy to spot an offending frequency that needs attenuating, or a range of frequencies
that require boost. The analyser display can be switched to input, output or off.