


13
STEREO
Control elements
appropriate frequencies, thus changing the spectral content of the original
signal. The S
TEREO VITALIZER , however, relies on a more subtle method of
amplitude-depending phase shifting. This does not involve altering the
spectral composition of the signal but it does maintain the subjective
impression of loudness. Moreover, graphic equalizers produce comb-filter
effects because of the interaction between adjacent filters, when broad-
band frequencies are raised. The M
ID-HI TUNE filter can raise the broad-
band spectrum with a very linear frequency response, without colouring
the signal.
Above the M
ID-HI TUNE value set, the STEREO VITALIZER filters create a
linear increase, i.e. one that is adapted to the human ear. This compensates
any inability of our hearing as regards perceiving frequencies ranging
between 5 kHz and 10 kHz. The M
ID-HI TUNE filter works with a wide
bandwidth and always sounds musical, never »bell-like«. Gradually go
down from 20 kHz (extreme left) to lower frequencies. The further down
you go, the brighter the sound image becomes, as an increasing number of
frequencies are included in the process.
The M
ID-HI TUNE control can also be used to tone down excessively
sharp-sounding material, by setting frequencies of 10 kHz or higher, and
setting the P
ROCESS control on MAX. Seeing as the PROCESS control is also
responsible for deleting dominant mid frequencies, all frequencies are
gradually reduced down to the application frequency, in conjunction with
high starting frequencies of the M
ID-HI TUNE control.
The P
ROCESS control determines the ratio between BASS and MID-HI TUNE
to the original signal. The HARMONICS control is not affected by the PROCESS
control.
The P
ROCESS control also determines the damping intensity of dominant
mid frequencies. This allows rapid adaptation to the loudness curves
(Fletcher-Munson curves, curves of equal loudness).
The human ear perceives the audio frequency spectrum at varying sound
pressure levels very differently. Perception is by no means »linear«. The
Process
5
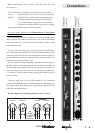
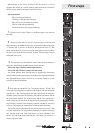
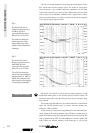
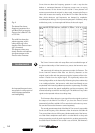
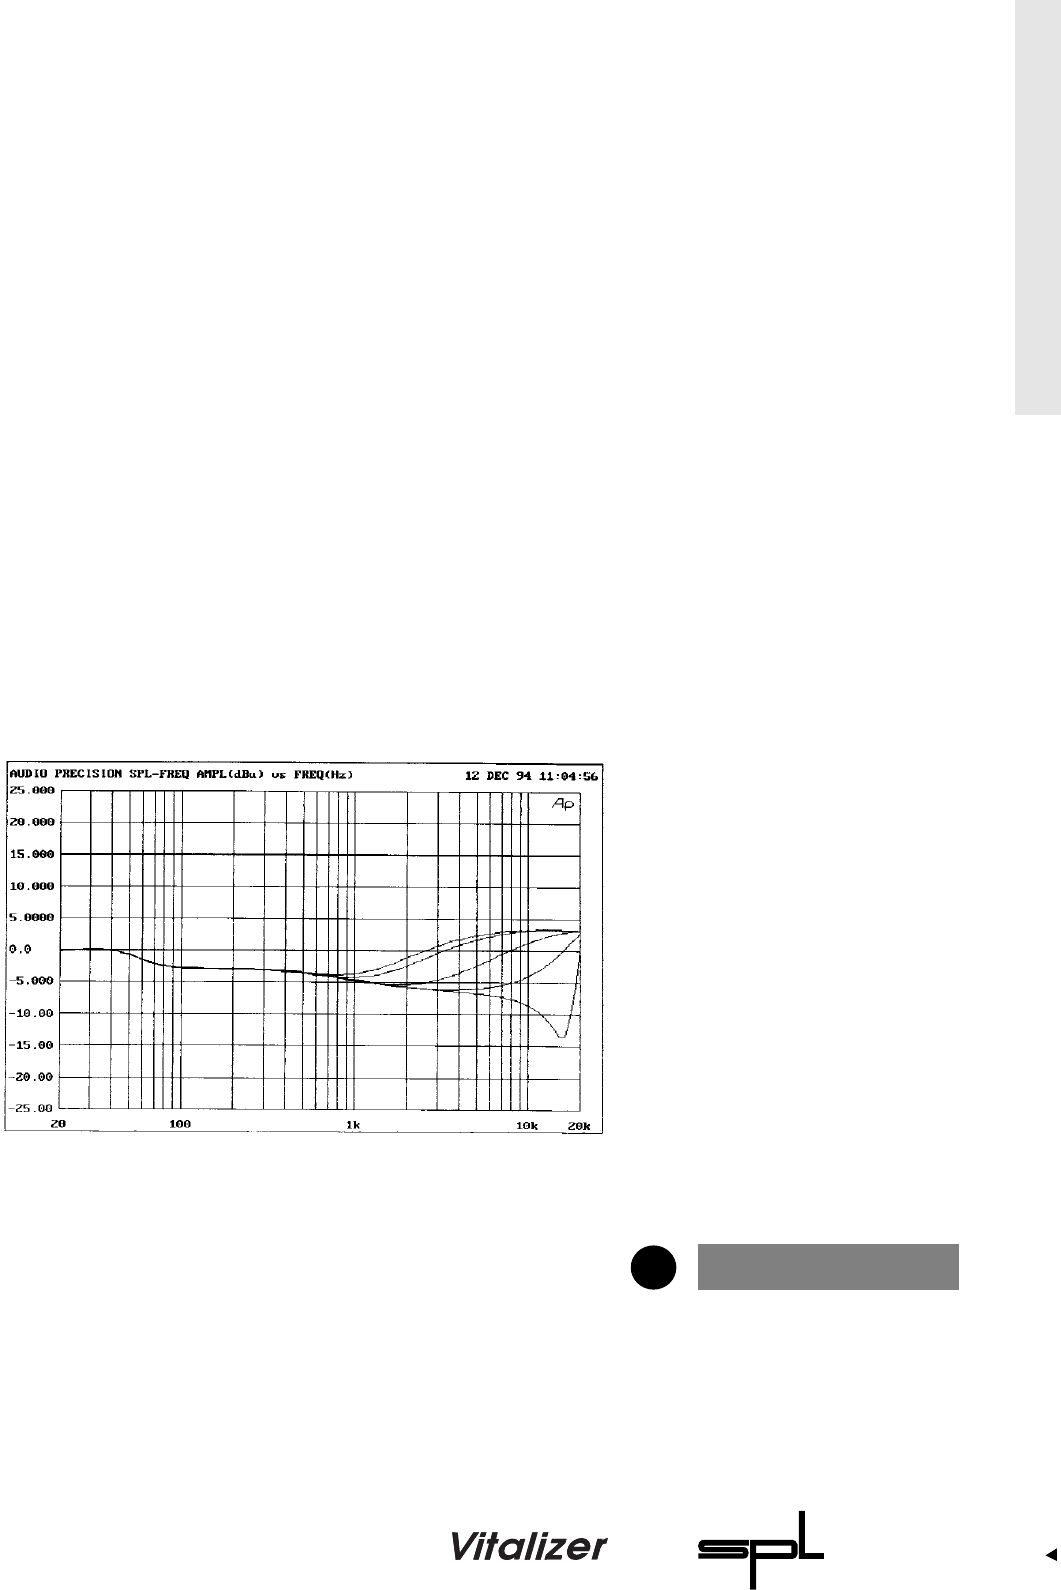
Fig. 3:
Five frequency responses are
shown for the MID-HI TUNE
filter at max. PROCESS value
and B
ASS at 0.
1. 1 kHz
2. 2 kHz
3. 3,5 kHz
4. 8 kHz
5. 20 kHz