23
How to Interpret the Graphs (Continued)
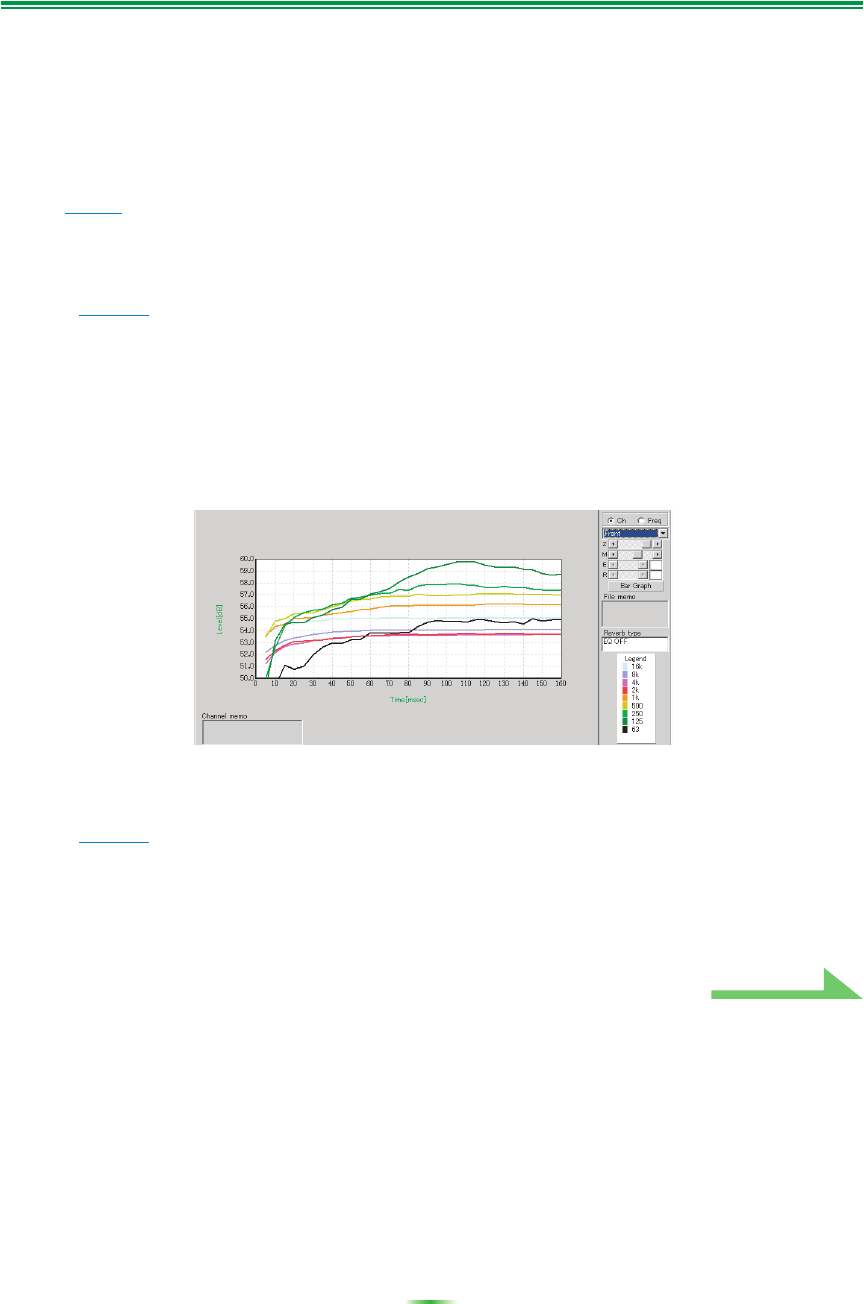
Displaying reverb characteristics after calibration
To display the graph of your listening area’s reverb characteristics with the equalization performed by this
receiver (after calibration), you’ll need to select the “EQ ON” option from the “Reverb Measurement” menu.
Using this graph, you can confirm the effects of MCACC calibration for your listening area.
1 Connect the receiver to your PC with a RS-232C cable.
See page 7 for more on connecting the RS-232C cable.
2 Select the “EQ Professional” option for “Manual MCACC”, and perform with
“Reverb Measurement” set to “EQ OFF”.
(See page 8
or page 43 of the receiver’s Operating Instructions.)
The reverb characteristics before equalization are measured.
If the “Auto MCACC” operation has never been performed, conduct the “Auto MCACC (ALL)” operation
here.
(See page 8 of the receiver’s Operating Instructions.)
3 Receive and save the data by selecting “Output PC” from “Data Management”.
When you receive and save this information on your PC, you will be able to see the graph of your
listening area’s reverb characteristics before calibration.
4 Select “Reverb Measurement” from the receiver’s “EQ Professional” menu and
choose the “EQ ON”.
(See page 8
or page 43 of the receiver’s Operating Instructions.)
Measure the room’s reverb characteristics after equalization with the microphone at the same position as
when the “Auto MCACC (ALL)” operation was performed. The measurements are performed with the EQ
values stored in the MCACC memory selected on the receiver, so before measuring the reverb
characteristics, select the MCACC memory to be measured after equalization.
Continue


