


Chapter 2 Measurement Studio .NET Class Libraries
Measurement Studio User Manual 2-6 ni.com
• Thermometer
•Tank
• Numeric edit
• Switch
•LED
Use this class library to add measurement-specific user interface controls
to your application. Configure the controls programmatically or through
the Properties window in the Windows Forms Designer. The following
sections describe each of the Measurement Studio user interface controls.
Tip For more information about easily using the .NET interface controls, refer to
the Using the Measurement Studio Windows Forms .NET Controls section in the
NI Measurement Studio Help.
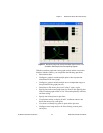
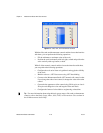
Waveform Graph and Scatter Graph Controls
Use the Measurement Studio waveform graph and scatter graph controls,
as shown in Figure 2-1, to display two-dimensional data on a Windows
Forms user interface. Use the waveform graph to display data that is
uniformly spaced in one dimension. Use the scatter graph to display data
that is arbitrarily spaced in two dimensions.