TWEETERS, WAVEGUIDES AND OPTIMAL
FREQUENCY RESPONSE
The dispersion pattern of the sound produced by a speaker is different at low
frequencies than at high frequencies. At frequencies with wavelengths greater
than the circumference of the speaker’s cone – the speaker’s piston range – the
sound is radiated in all directions. At higher frequencies, the dispersion pattern
narrows. At frequencies for which the circumference of the speaker is about five
times the sound’s wavelength, the coverage area narrows sharply and the off-axis
sound contains far less high-frequency content. This phenomenon occurs for every
speaker. For multi-way speaker systems, designers have to contend with this
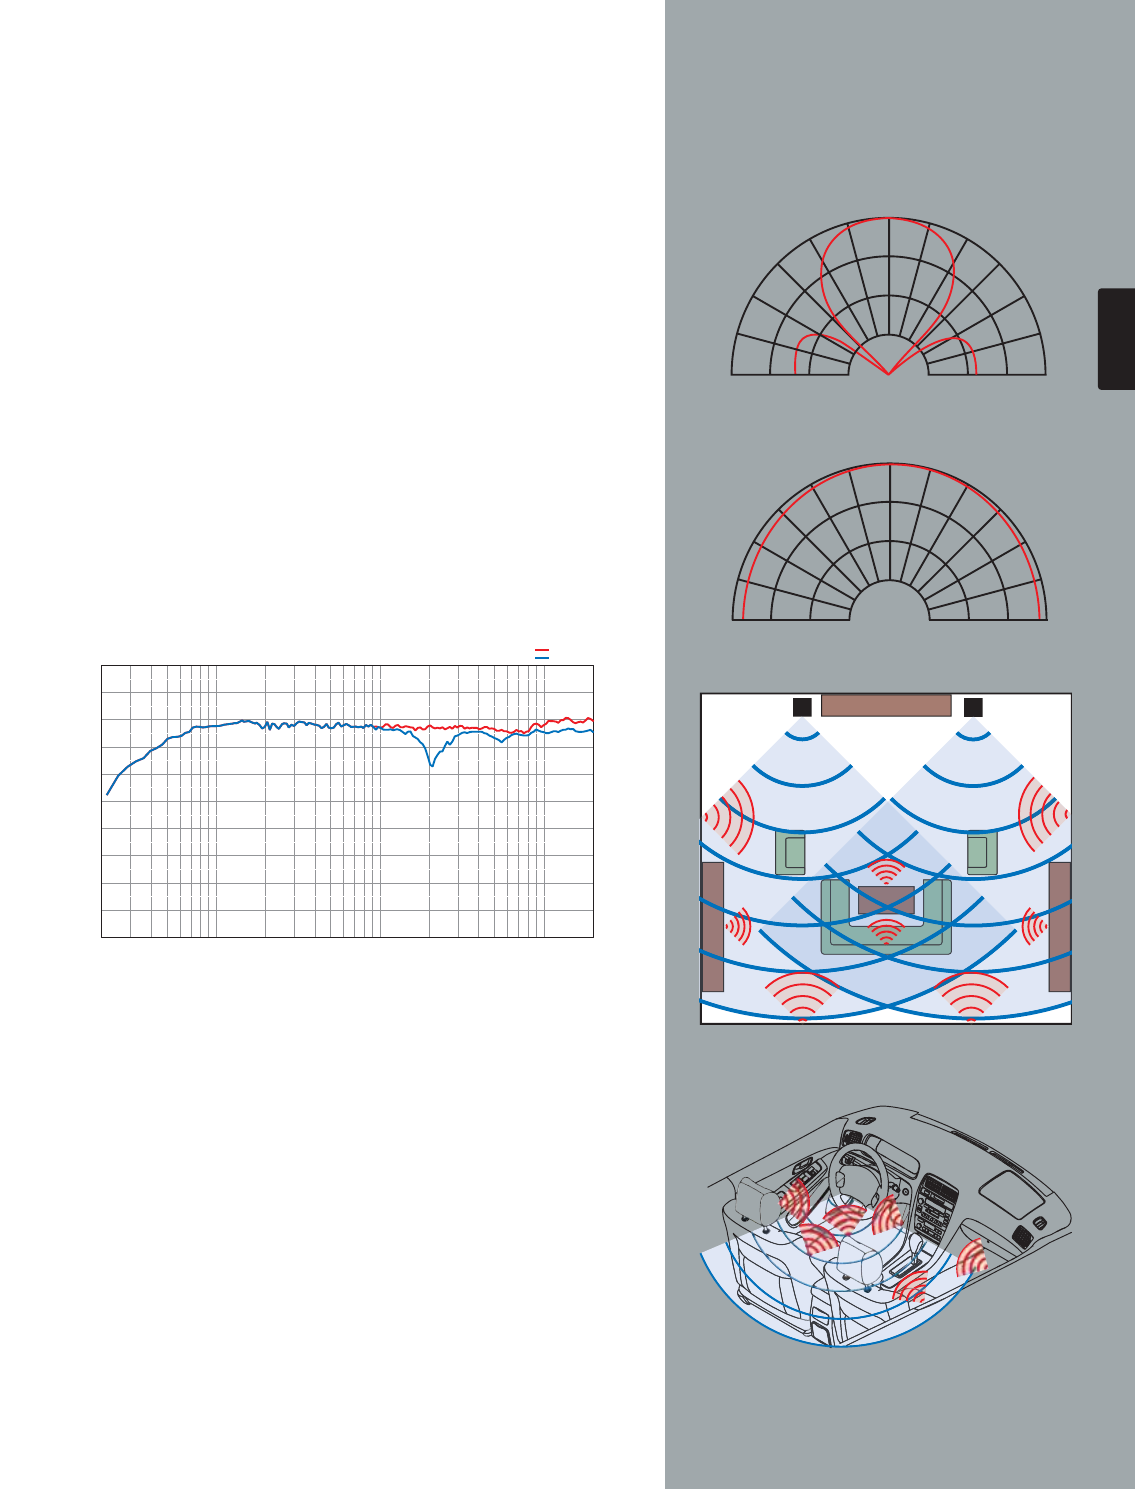
condition for each driver in the system. What makes matters more difficult is
that in the crossover region between a large low-frequency driver and a small
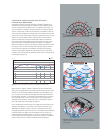
high-frequency driver, the speakers’ behaviors are opposite – the dispersion
pattern of the woofer is narrow and the dispersion pattern of the tweeter is wide
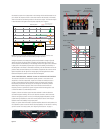
(see Figures 2 and 3). A multi-way speaker that is designed using only measure-
ments of the on-axis response can sound terrible. An analysis of the frequency
response of many speakers designed this way reveals a big hole in the off-axis
response at the crossover frequency, where the woofer’s output is focused into the
forward angles (see Figure 4).
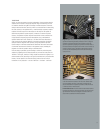
When we listen to speakers, we hear a combination of the sound that comes
directly from the speaker (the on-axis response) and the off-axis response, which
arrives at our ears after being reflected by boundaries and other objects in the
room. In large rooms, the walls and other objects are often located several feet
from the speaker enclosure, so the intensity of the reflected sound is lower than
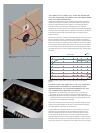
that of the direct sound. In rooms, the direct sound in the “listening window”
dominates the sound we hear. The off-axis sound is a secondary but important
part of the overall sound of the speaker (see Figure 5).
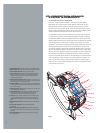
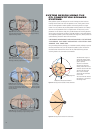
In cars, the boundaries are much closer to the speaker and to the listener, so the
intensity of the reflections is more similar to the intensity of the direct sound.
Additionally, the reflective surfaces in a car are so close that our brains can’t
distinguish between the direct sound and much of the reflected sound. Reflections
contribute greatly to the quality of the audio experience in cars. Since it isn’t
practical to change the overall shape or size of the car to minimize the effects
of the reflections, closely matching the on- and off-axis responses of the speaker
system can help to ensure a smooth and balanced sound (see Figure 6).
90°
60°
30°
0°
270°
–20
–10
0
–30
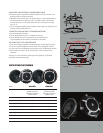
Figure 2. Woofer dispersion pattern in the crossover region.
Figure 4. On- and off-axis frequency response of a conventional component system.
Figure 3. Tweeter dispersion pattern in the crossover region.
90°
60°
30°
0°
270°
–20
–10
0
Figure 5. Reflected sounds are attenuated at the listening position
because the boundaries are far from the speakers and the listener.
Sound from Speakers
Reflected Sound
Figure 6. The intensity of reflected sounds in a car closely match that
of the direct sound, because the boundaries are close to the speakers
and the listeners.
Sound From Speakers
Reflected Sound
7
ENGLISH
On Axis
Off Axis
20Hz 50 100 200 500 1K 2K 5K 10K 20K
dBSPL
10
20
30
40
50
60
70
80
90
100
110


