20 THE AUDIO CRITIC
woofers using 12" to 15" diameter dri
-
vers indicate a ratio of about 28 dB be-
tw
een the nearfield sound pressure and
that measur
ed in the farfield (usually 2
m gr
ound-plane measurements, which
correspond to 1 m free-field measure-
ments); i.e., the nearfield pressure is 28
dB louder than the farfield pressure.
Fig. 7 plots the THD values com-
puted from the amplitude of the 2nd
to 5th harmonics as a function of the
fundamental’s SPL. The figure indi-
cates a robust bass output rising above
110 dB at distortion levels less than
10% between 40 and 80 Hz. At lower
frequencies, the distortion rises to
higher levels at correspondingly lower
fundamental SPL levels, although,
even at 25 Hz, levels above 100 dB can
be generated at distortion levels below
20%. All in all, the 4.1t’s subwoofer
can reach some fairly impressive levels
in the bass range. Remember, however,
that at low frequencies in a typical lis-
tening room, subwoofers can play sig-
nificantly louder due to room gain
than they can in a free-space environ-
ment without room boundaries.
Fig. 8 plots the 4.1t subwoofer’s
maximum peak SPL as a function of
frequency for a transient short-term
signal, which was a shaped 6.5-cycle
tone burst. The graph represents the
loudest the sub can play for short pe-
riods of time in a narr
o
w r
estricted fre-
quency band in a free-space
envir
onment. I
n-room levels will be
significantly higher. These levels are
significantly higher than the contin-
uous sine wav
e lev
els sho
wn pr
eviously
in Fig. 7 and represent the peak levels
that can be reached short term, using
typical program material. These data
indicate that below 40 Hz the 4.1t sig-
nificantly outperformed its prede-
cessor
, the Compositions P-FR system,
as I noted in the intr
oduction.
The
bass output of the 4.1t places it solidly
in the upper thir
d of all the systems I
have tested, including several stand-
alone subs.
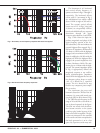
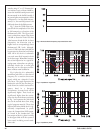
Fig. 5: Impedance magnitude.
Fig. 6: Impedance phase.
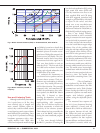
Fig. 4: Vertical off-axis frequency responses below axis.


