


ISSUE NO. 28 • SUMMER/FALL 2002 19
The I
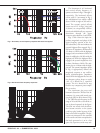
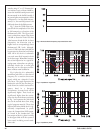
ntermezzo 4.1t’s horizontal
and vertical off-axis frequency re-
sponses ar
e shown in Figs. 2 through 4,
r
espectively. The horizontal off-axis
cur
ves with 15° increments in Fig. 2
are well-behaved but exhibit rolloff
above 12 kHz at angles of 30° and be-
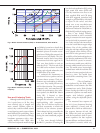
yond. The system’s vertical off-axis
curves out to ±15° in Figs. 3 (up) and
4 (down) are exceptionally well-be-
haved and exhibit hardly any response
aberrations through the upper
crossover region between 2 and 3 kHz.
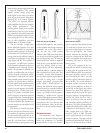
Figs. 5 and 6 show the input im-
pedance magnitude and phase of the
upper frequency portion of the 4.1t
(less subwoofer), with and without the
system’s highpass filter engaged. Fig. 5
indicates an impedance minimum of
3.2 ohms at 120 Hz with the highpass
engaged, and a maximum of about 18
ohms is exhibited at 2.8 kHz with the
highpass off. With the highpass filter
engaged, the system’s impedance rises
to above 20 ohms at 20 Hz. The min-
imum rises to 4.4 ohms with the high-
pass off. The system’s impedance phase
in Fig. 6 appropriately follows the
magnitude response as any well-be-
haved minimum-phase impedance
should. With the highpass filter on, the
low-frequency phase drops to nearly
–90°, as it should for a capacitive
system. The 4.1t should be an easy
load for any competent po
w
er ampli
-
fier or receiver.
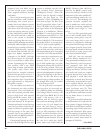
The continuous sine wav
e total
harmonic distortion (THD) of the In-
termezzo 4.1t versus axial sound pres-
sur
e lev
el (SPL) in dB is sho
wn in F
ig.
7. The THD for each frequency in the
range of 20 to 80 Hz at each third oc-
tave is plotted separately in the figure.
The level was raised until the distor-
tion became excessive or the system
could not play louder because of the
limits of its built-in amplifier
.
The dis-
tortion was measured in the nearfield
of the woofer and then extrapolated to
the levels generated at 1 m in a free
space. My experiences with many sub-
Fig. 1: One-meter, on-axis frequency response.with 2.83 V rms applied.
Fig. 2: Horizontal off-axis frequency responses.
Fig. 3: V
er
tical of
f-axis fr
equency responses above axis.