


11
CASCADE MODEL FIFTEEN
T
he pointer on the slider will indicate the correct width setting.
Enter this number in the Width field of the Measurement
T
emplate. In our example, the width is 12.5%.
It is not realistic to expect a perfect fit.Acoustic
measurements encompass the behavior of not only the speakers
but of the room and its contents as well. Reflected energy,
standing waves and ambient noise all add their part. Determining
t
he best width setting nearly always requires compromise.
Level
This setting will define the amount (level) you want to reduce the
p
eak, in decibels.
The R.A.B.O.S.level adjustment is limited to attenuation only, and
is adjustable from 0dB to –14dB.After optimization, the
R.A.B.O.S. equalizer will eliminate the largest low-frequency peak;
therefore, the broadband bass level can be increased without
overpowering the midrange frequencies. R.A.B.O.S. applies this
compensation automatically.
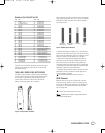
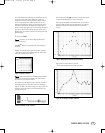
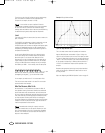
You will use the Width Selector as an aid in determining the
correct level setting. Place the Width Selector as described
above and adjust it to the correct width. Observe the first
frequency point on the high-frequency side of the peak that no
longer follows the slope of the Width Selector. In this example,
this point is 56Hz. Calculate the average level of the readings
from 56Hz up to 100Hz – in this example, that’s 10 data points.
Whenever your answer has a remainder, always round down
(disregarding the negati
ve [–]) to the next whole number.
In our example, you would enter “9”in the attenuation field.
This may not be the best method in all cases.The next section
contains several other examples.
What You Measure,What to Do
As stated earlier, it is not possible to anticipate the effect of
every possible listening environment. However, most residential
sound rooms share many characteristics, and their dimensions
fall into a range that make some response irregularities far more
likely than others. On the following pages are examples of what
you may encounter. Following each example is a strategy for
correction. Compare your measurement results with the following
e
xamples
.
F
ind the one that best f
its your graph and f
ollow the
instructions presented for that scenario.
Remember, when looking for a match, look at the
descriptive characteristics, not any specific frequency or level.
Each of these examples can occur at any frequency,bandwidth
and level. It is unlikely that your test results will be exactly as
depicted in these e
xamples
.
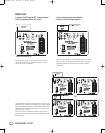
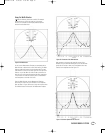
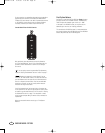
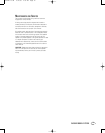
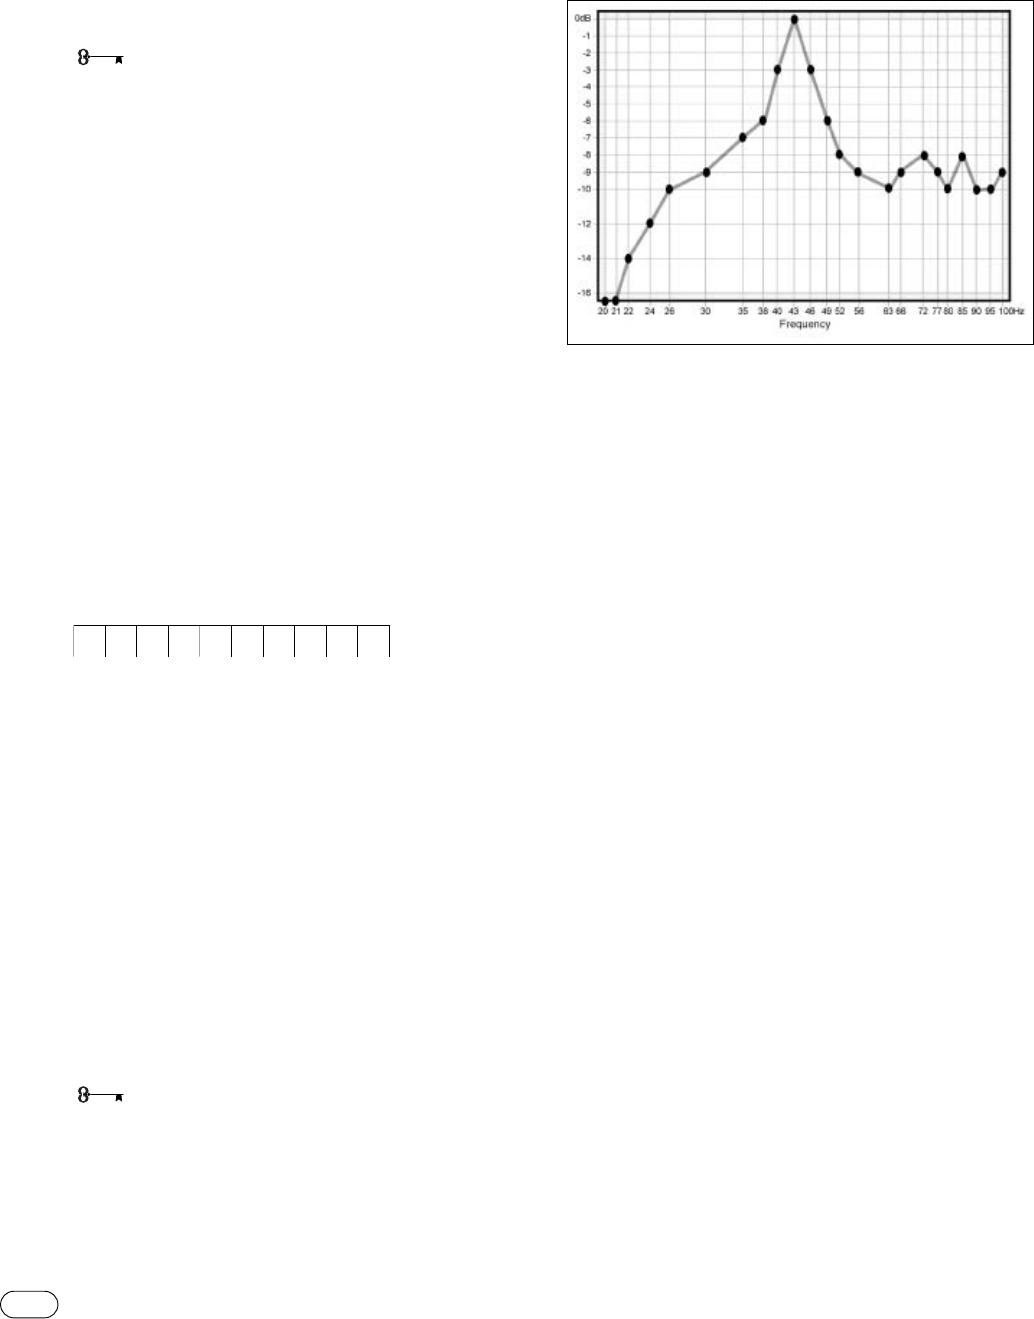
E
xample 1.
S
ingle Dominant Peak
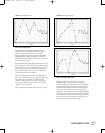
This is the most common result of speaker/room interaction.
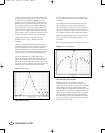
Apply the Width Selector as described in Figure 13.Align the
center line of the Selector over the center of the peak, as shown
in Figure 14. Now adjust the Selector until you have achieved the
“best fit.”The slider now points to the correct bandwidth setting.
In this example, the frequency is 43Hz and the best-fit width is
12.5%. Fill in the Width and Frequency fields provided on the
template.
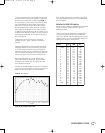
Determine the appropriate level using the technique described
earlier. In this example, –9dB would be best. Enter the level in
the field provided.
Skip to the “Adjusting the R.A.B.O.S. Equalizer”section on page 14.
56Hz 63Hz 6
6Hz 72Hz 77Hz 8
0Hz 85Hz 90Hz 9
5Hz 100Hz
–9 –10 –8 –9 –10 –9 –8 –10 –10 –9 –
92 ÷ 10 = –9.2
Figure 15. Single dominant peak
Cascade 15 OM 9/14/05 2:35 PM Page 14