Web Interface Overview
12
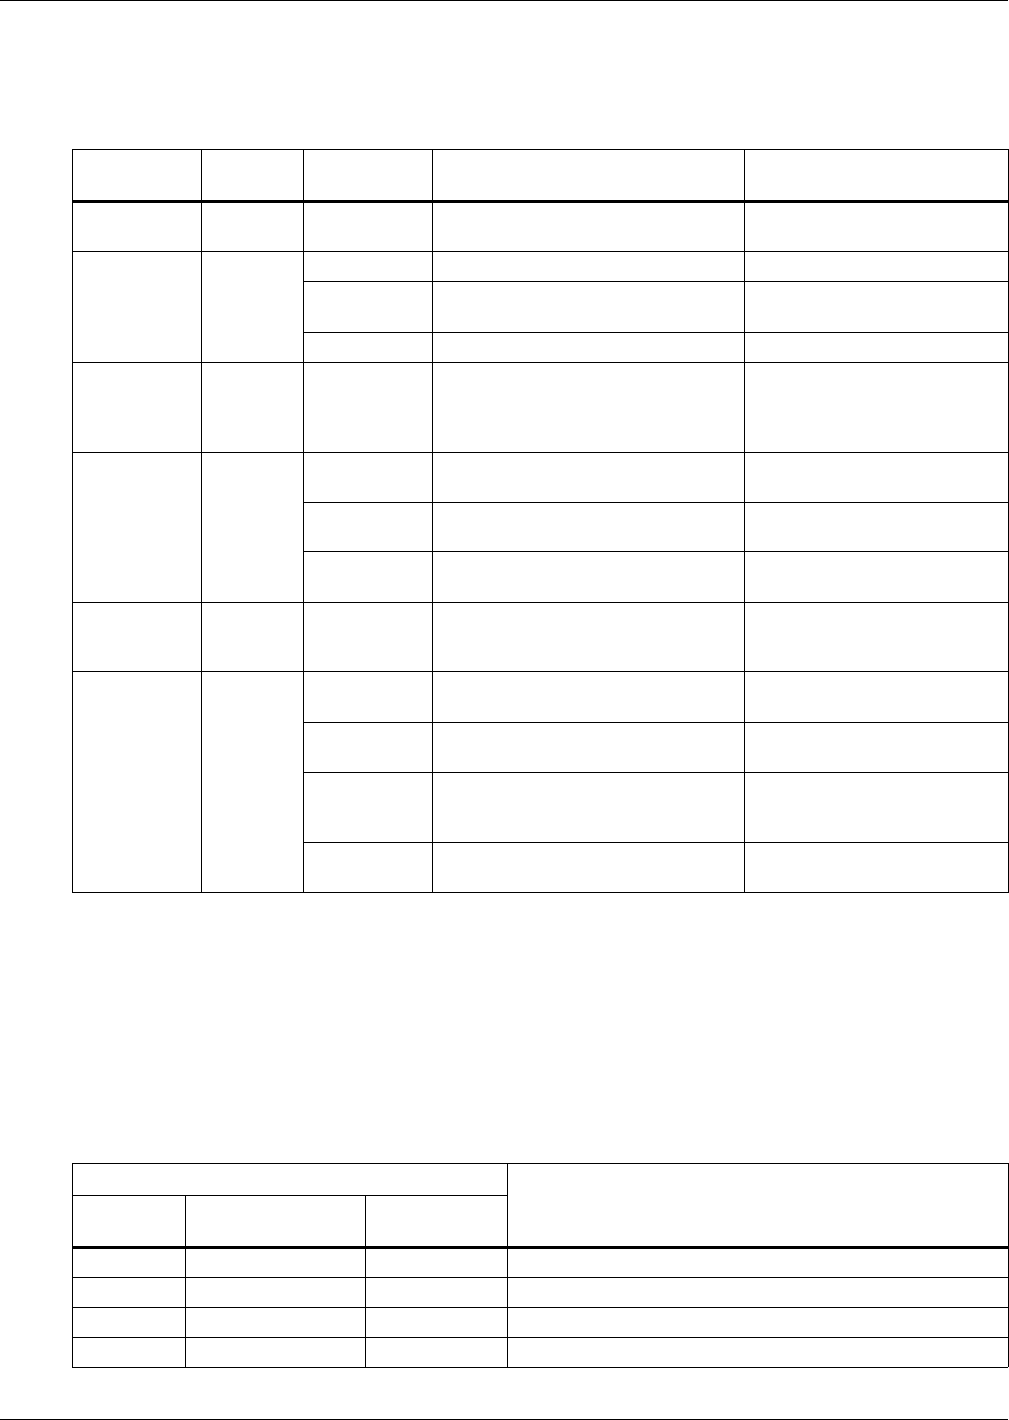
4.2 Tabs
The tabs at the top right of the Web interface window provide access to all the functions of the
OpenComms EM device. Table 5 summarizes these functions and where to find more information.
4.3 Color-Coded Status
The Web interface uses color coding to indicate the status of sensors connected to the unit, as shown
in Table 6, to help you quickly identify sensors that require attention.
In EM PDU and vEM-14 controllers, the same color scheme is used for MP Advanced Power Strips
connected to the unit.
These colors are used to display the sensor’s name, the current reading and the status of the sensor;
the colors are also used in line graphs to indicate alarm thresholds.
Table 5 Summary of tab functions
Tab Display
Additional
Links
Description For details, see:
Summary
Summary
window
—
View current value & status of all
connected devices
5.2 - View Summary Data
Sensors
Sensors
window
Data View all data for connected devices 5.3.1 - Configure Sensors
Names
Change names of connected
devices
5.3.2 - Create or Change
Sensor Names
Graph Display data in graph format 5.3.3 - View Sensor Graphs
Power
(EM PDU &
vEM-14
controllers)
Power
window
—
View and set up MP Advanced
Power Strips
5.4 - Power Window
(EM PDU & vEM-14
Controllers)
Alerts
Alerts
window
Email
Activate and configure automatic
e-mail alerts
5.5.1 - E-Mail Setup
Modem
Activate and configure automatic
pager alerts
5.5.2 - Modem Setup
SNMP Traps
Activate and configure automatic
SNMP trap alerts
5.5.3 - SNMP Trap Alerts
Setup
Security
Security
window
—
Change password to Web interface;
set up additional users, type of
access, timeout after inactivity
5.6 - Security Window
Sys Info
Sys Info
window
Network
Connectivity
Configure network settings 5.7.1 - Network Connectivity
SNMP
Information
Configure unit for SNMP 5.7.2 - SNMP Information
Data
Presentation
Change time intervals for updating
sensor data, Web page refresh;
change temperature units (°F / °C)
5.7.3 - Data Presentation
Serial Ports
(not used)
View or change settings for serial
ports 1 and 2
5.7.4 - Serial Ports
Table 6 Color coding used in Web interface
Display Color
Meaning
Sensor
Name
Status &
Current Value
Graph
Line Color
Red Red Red Critical state (High Critical, Low Critical, Critical)
Yellow Yellow Yellow Warning state (High Warning, Low Warning)
Green Green — Normal
Gray Black — Not present (not connected to unit)