


12
STEREO
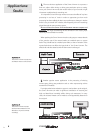
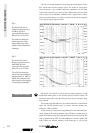
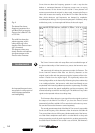
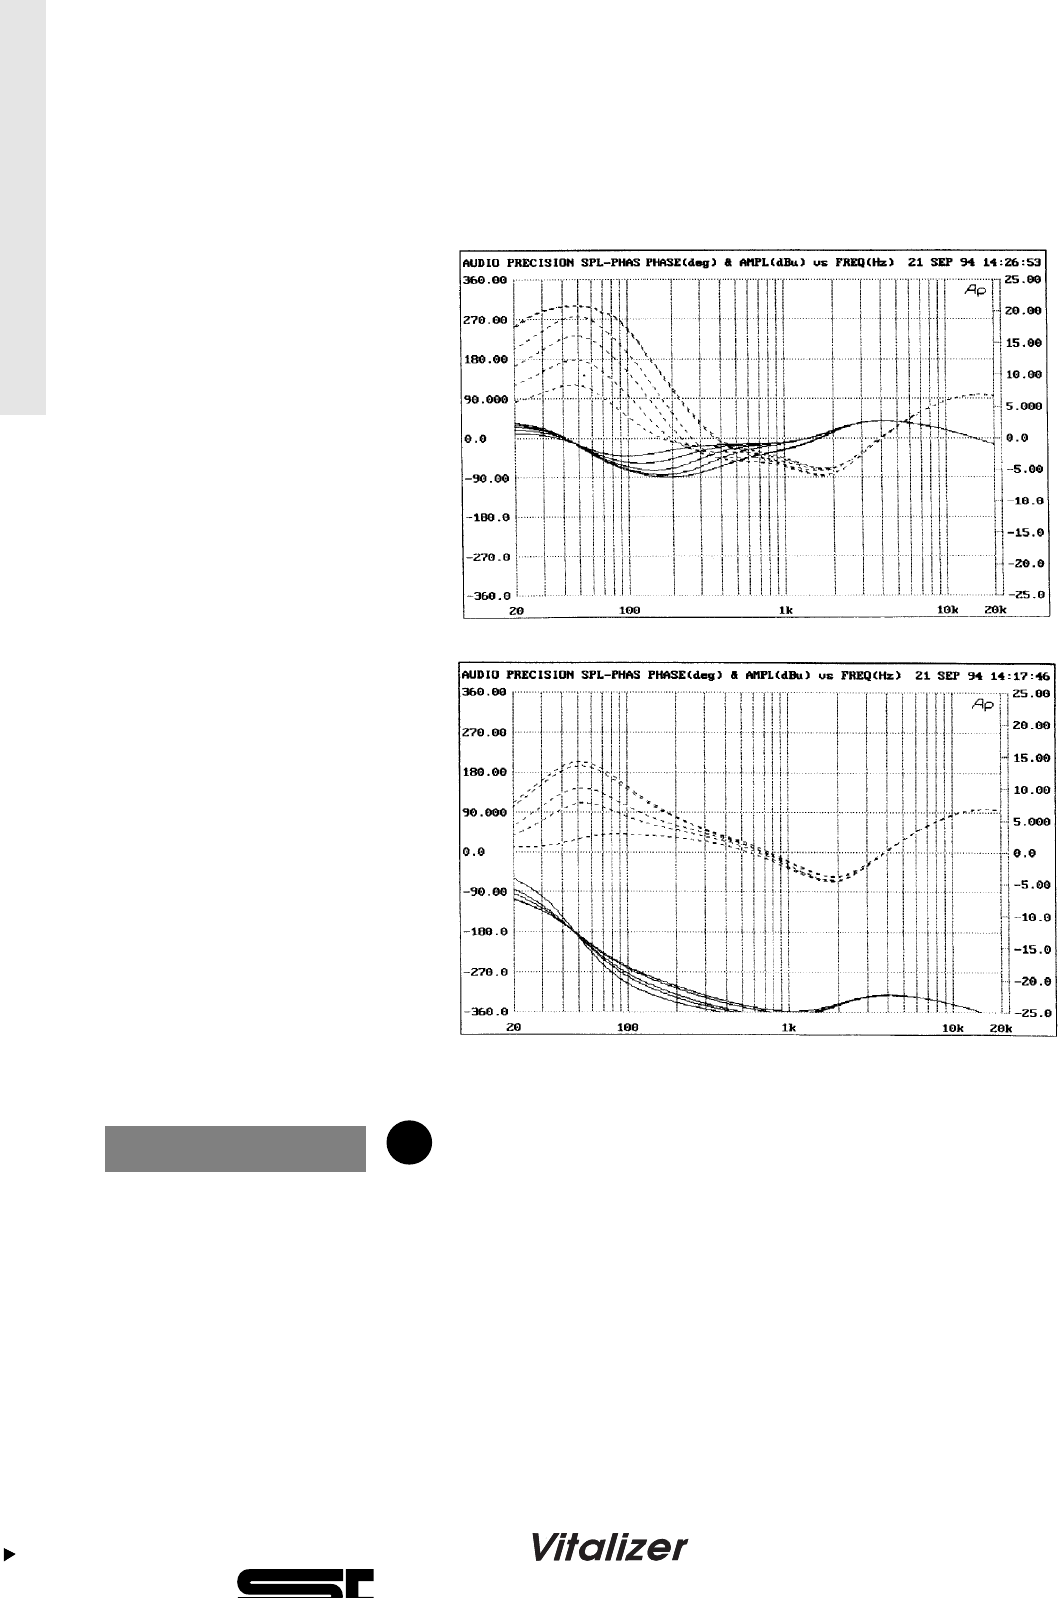
Fig.1:
The dotted line shows
frequency responses for a
soft Bass (S
OFT)at
maximumP
ROCESS and a
M
ID-HI TUNE of 3.5 kHz.
The solid line shows the
phase response, which
always drifts only a few
degrees if the amplitude is
increased.
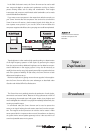
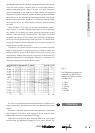
Fig. 2:
The dotted line shows
frequency responses for a
hard Bass(T
IGHT)at
maximum P
ROCESS and a
M
ID-HI TUNE of 3.5 kHz.
The solid line shows the
phase response whichhas a
phase relation of -180° at
50 Hz, but otherwise also
drifts only by a few degrees
at increasing amplitudes.
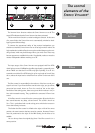
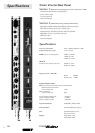
Control elements
The PROCESS control determines the processing ratio between the set
bass sound colour and the original signal. This results in varying bass
sound structures: if you combine high bass amplification on the B
ASS
control with a lower PROCESS value, you get a different bass structure than
with a lower bass amplification combined with a higher P
ROCESS value.
Choosing the best solution is a matter of personal taste and also depends
on the type of original signal involved.
The M
ID-HI TUNE control is used to set the starting frequency of the
broad-band shelving filter. In line with the setting of P
ROCESS control, all
frequencies above this value right through to the end of the audio range
are processed.
The control range of the M
ID-HI TUNE control is between 1 kHz (extreme
right) and 20 kHz (extreme left). In practice, common settings vary
between 3.5 kHz and 8 kHz.
As the human ear perceives the range between 1 kHz and 3 kHz parti-
cularly clearly, at all volumes between 0 and 120 phon it makes sense to
adapt this frequency range. You might feel inclined to say "Yes, but I do that
with my graphic EQ as well". The main difference is that the graphic EQ
really reduces the effective loudness of the frequency, i.e. cuts out the
4
Mid-Hi Tune