


6
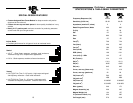
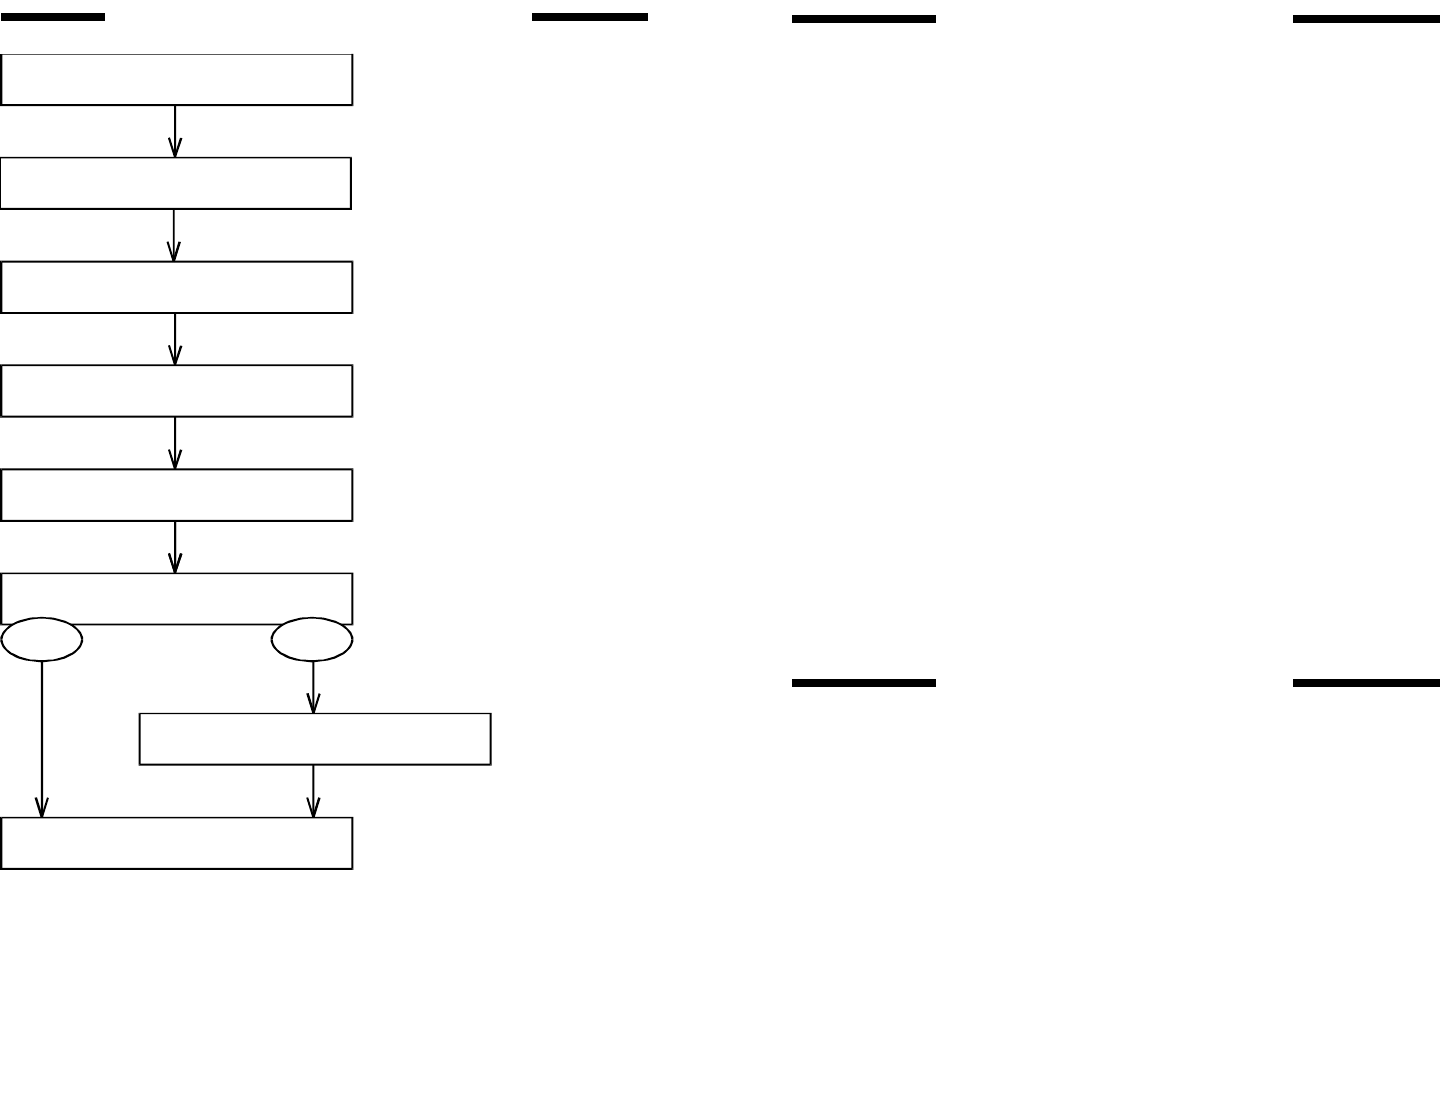
Measure maximum possible dimensions
Multiply wall thickness by 2
Subtract this from each dimension to
arrive at Gross Internal Dimensions
Multiply LxWxD to arrive at
Gross Internal Volume
Deduct Vf (volume of the speaker frame)
from Gross Internal Volume
Braces?
No Yes
Calculate brace volume and deduct
from Gross Internal Volume
Deduct Vf (volume of the speaker frame)
from Gross Internal Volume
You are at Net Internal Volume
in cubic inches (in )
3
To convert to LITERS:
Divide in by 61.03
To convert to CUBIC FEET:
Divide in by 1728
3
3
ENCLOSURE VOLUME FLOWCHART
7
BUILDING THE ENCLOSURE
• Determine the dimensions of your enclosure.
• Be certain the box you have designed will fit into the location you have
chosen. Sometimes making a cardboard box with the same outside
dimensions is helpful.
• Use 3/4 inch thick Medium Density Fiberboard (MDF) or High Density
Particleboard. It is preferable to cut the wood with a table saw to ensure
straight, even joints. If a table saw is not available, a circular saw is
acceptable.
• Use a “T” square to verify precise right angle gluing.
• Use a high quality wood glue and air nails or wood screws to assemble the
enclosure. Elmer’s woodworker’s glue and Weldwood work well. To
guarantee an airtight box, seal each inside joint with silicone sealant.
• For Sealed Enclosures, stuff the chamber with 50-75% filling (approximately
1.5 pounds per cubic foot) of fiberglass insulation or Dacron.
• For Vented Enclosures, staple 1 inch thick fiberglass insulation or Dacron to
all walls of the enclosure except the baffle to which the woofer is mounted.
• Use the supplied gasket to seal the woofer in the enclosure and eight(8)
wood screws or T-nuts and bolts. Progressively tighten each of the bolts or
screws to prevent warping the woofer frame.
• Use slide-on connectors to attach speaker wires. Do not solder wires to the
SUGGESTED ENCLOSURES
The following designs include a variety of enclosure sizes and types.
Each design has two frequency response curves; one showing predicted
“In-Car” response, and the other showing “Half-Space Anechoic” (out-of-car)
frequency response. The performance difference between the two curves is a
result of the natural acoustics of an “average” automotive environment. This
“average” transfer function is only an approximation of what you may expect to
see in your car. Every car is different. Each curve was generated using 2.0
Volts across both voice coils in parallel and measured at 1 meter. Also, each
frequency response curve includes a 12 dB/octave low pass at 100 Hz. The
response curves can help you visualize relative performance differences
between designs. Read through the descriptions given for each enclosure and
select the one that suits your needs.
Remember: all suggested enclosure volumes are Net, and DO NOT include
woofer, port, and bracing displacement!