15
Application Operations (Continued)
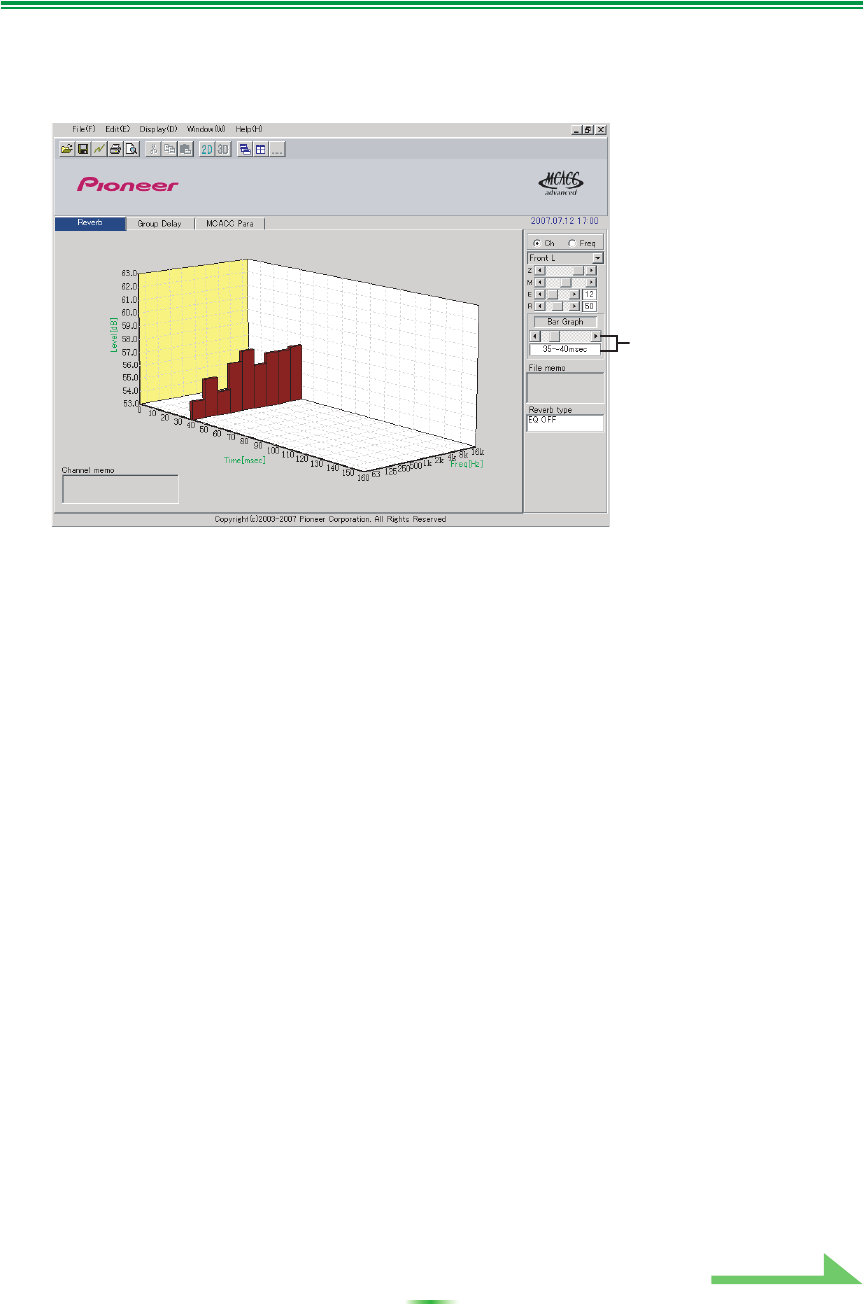
10 Bar Graph
Changes the type of graph display. The display switches between the band graph and bar graph by
pressing this button.
11 File memo
Memos concerning the file (conditions at the time of measurement, etc.) can be stored for the different
items.
12 Reverb type
Indicates whether the reverb characteristics are before calibration (EQ OFF) or after calibration (EQ ON).
(For the reverb characteristics after calibration, the EQ calibration curve and calibration time position are
displayed.)
13 Legend
Shows which colors in the graphs correspond to which channels or frequencies.
14 Freq [Hz]/Channel
In channel display mode, it becomes the frequency axis. In frequency display mode, it becomes the
channel axis.
15 Group Delay [msec]
This axis indicates the group delay amount (length of group delay time).
16 Freq [Hz]
This is the frequency axis.
17 Before calibration/after calibration selector buttons
The group delay characteristics before calibration are indicated when “Before” is selected, the
characteristics after calibration are indicated when “After” is selected.
18 Channel
This is the channel axis.
19 List display/individual display selector buttons
All the MCACC memories are displayed when “ALL MEMORY” is selected, individual MCACC memories
are displayed when set for individual displays (“MEMORY1”, etc.).
Reverb:
Move the time axis.
Group Delay:
Move the frequency
axis.
Continue


