


MODULUS II HOME THEATER SYSTEM
12
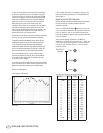
Each of the following tracks produces a low-frequency test tone.
The range of these tests is from 100Hz down to 20Hz.The
frequency of each test is announced before it begins.The first
test is the highest frequency (100Hz); therefore, you will be
marking the template from right to left. Each frequency point is
listed across the bottom of the Measurement Template (this is
called the X-axis). See Figure 16 on the previous page.The
vertical scale on the left side of the template indicates relative
level, in dBs (the Y-axis).The template’s vertical scale matches
that of the RSLM bar graph.
Cue Track 4 and
Pause II.
From now on, you will want to keep your CD player’s
remote control handy.
Press
Play . As Track 4 plays, observe the level indicated on
the RSLM.
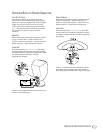
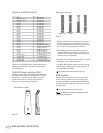
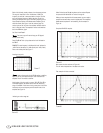
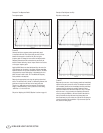
EXAMPLE:The test frequency is 100Hz and the level indicated is
–2dB. Find the intersection of 100Hz (X-axis) and –2dB (Y-axis).
Place a dot at that point. See Figure 17.
It takes a few seconds for the RSLM reading to stabilize,
especially at very low frequencies. Don’t rush. Give each test
adequate time for the meter to stabilize.
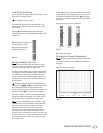
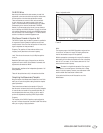
At the bottom of the bar graph is a green “ON”LED.This LED is
illuminated whenever the sound level is below the measuring
range of the RSLM. If this occurs during a test, place a dot at the
intersection of the test frequency and the bottom frame of the
template. See Figure 18.
When finished,press
Skip
››
l
to advance to the next test. Repeat
the process described above for Tracks 5 through 26.
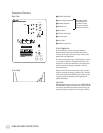
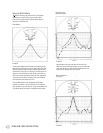
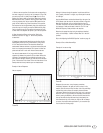
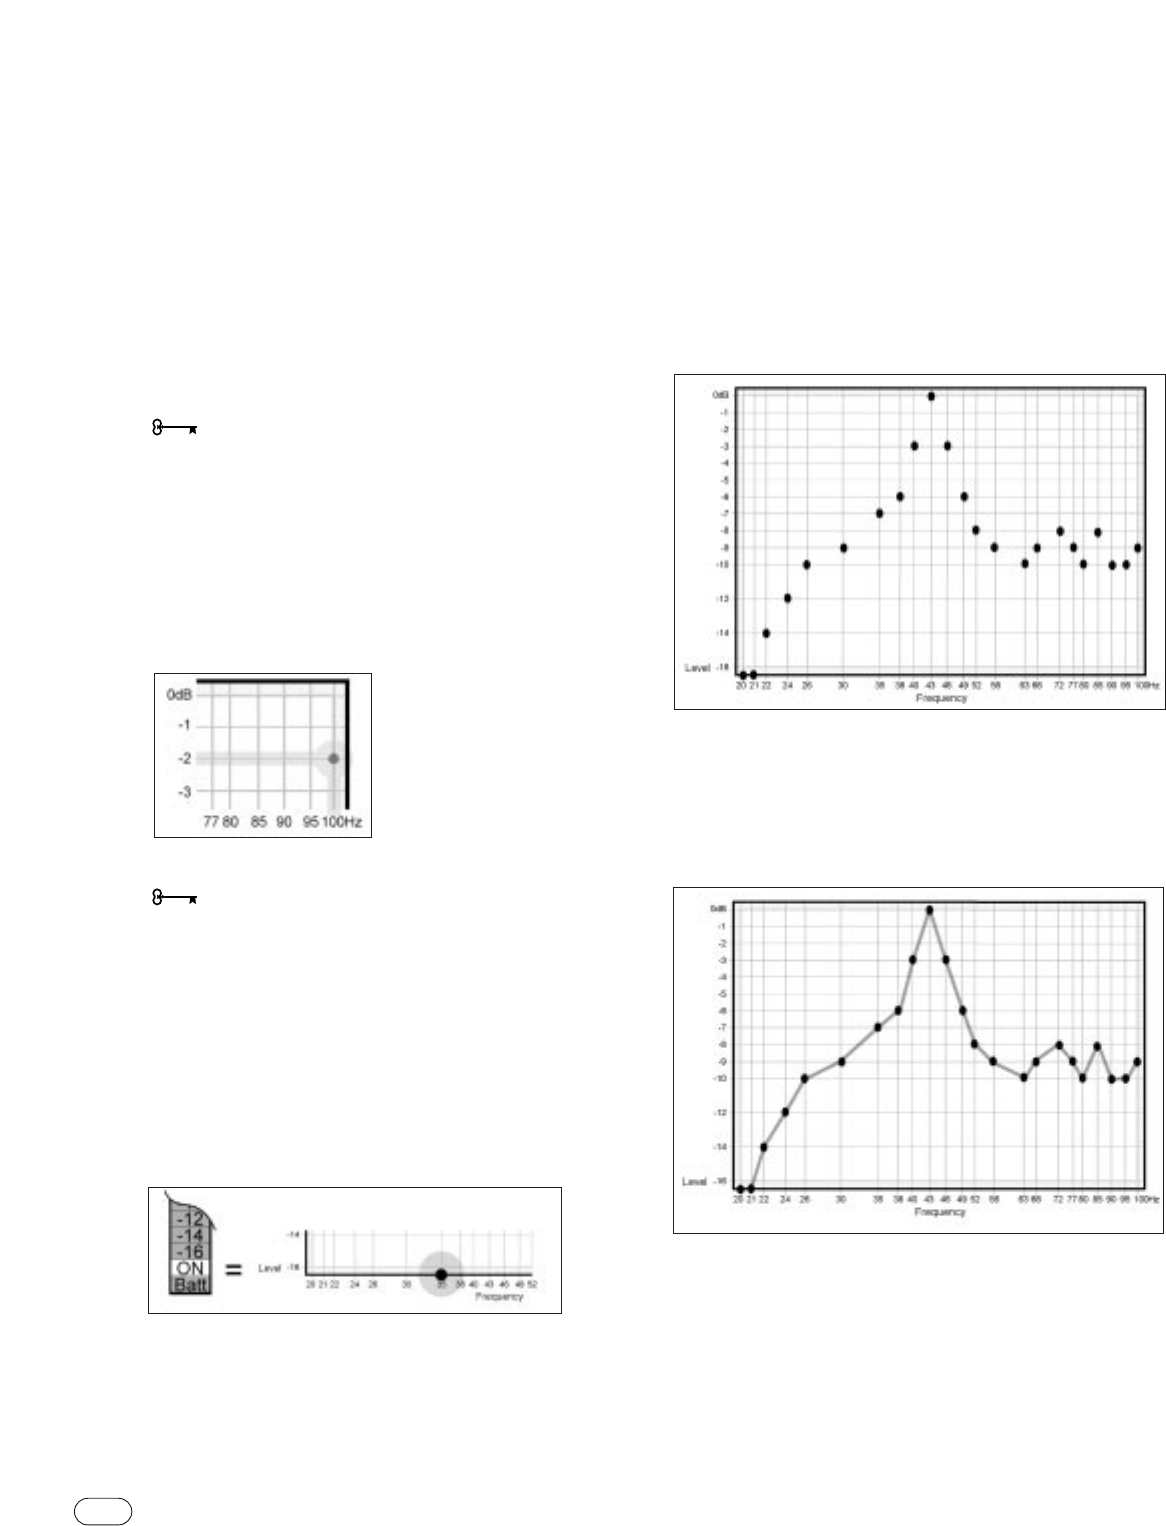
When you have completed the 23 measurements, you are ready to
analyze the data and make corrective adjustments.The completed
Measurement template will look something like the example in
Figure 19.
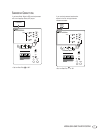
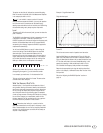
Now connect the dots as shown in Figure 20.
This will make interpretation of the data much easier.
▼
Locating a test point
Indicating an under-range test
Completed R.A.B.O.S.template
Test example with dots connected
FIGURE 17
F
IGURE 18
F
IGURE 19
F
IGURE 20